Back to Part 8
Magnitude response
The magnitude response* of any audio device is a measure of how much its output level deviates from the expected level at different frequencies. In a turntable, this can be measured in different ways.
Usually, the magnitude response is measured from a standard test disc with a sine wave sweep ranging from at least 20 Hz to at least 20 kHz. The output level of this signal is recorded at the output of the device, and the level is analysed to determine how much it differs from the expected output. Consequently, the measurement includes all components in the audio path from the stylus tip, through the RIAA preamplifier (if one is built into the turntable), to the line-level outputs.
Because all of these components are in the signal path, there is no way of knowing immediately whether deviations from the expected response are caused by the stylus, the preamplifier, or something else in the chain.
It’s also worth noting that a typical standard test disc (JVC TRS-1007 is a good example) will not have a constant output level, which you might expect if you’re used to measuring other audio devices. Usually, the swept sine signal has a constant amplitude in the low frequency bands (typically, below 1 kHz) and a constant modulation velocity in the high frequencies. This is to avoid over-modulation in the low end, and burning out the cutter head during mastering in the high end.
* This is the correct term for what is typically called the “frequency response”. The difference is that a magnitude response only shows output level vs. frequency, whereas the frequency response would include both level and phase information.
Rumble
In theory, an audio playback device only outputs the audio signal that is on the recording without any extra contributions. In practice, however, every audio device adds signals to the output for various reasons. As was discussed above, in the specific case of a turntable, the audio signal is initially generated by very small movements of the stylus in the record groove. Therefore, in order for it to work at all, the system must be sensitive to very small movements in general. This means that any additional movement can (and probably will) be converted to an audio signal that is added to the recording.
This unwanted extraneous movement, and therefore signal, is usually the result of very low-frequency vibrations that come from various sources. These can include things like mechanical vibrations of the entire turntable transmitted through the table from the floor, vibrations in the system caused by the motor or imbalances in the moving parts, warped discs which cause a vertical movement of the stylus, and so on. These low-frequency signals are grouped together under the heading of rumble.
A rumble measurement is performed by playing a disc that has no signal on it, and measuring the output signal’s level. However, that output signal is first filtered to ensure that the level detection is not influenced by higher-frequency problems that may exist.
The characteristics of the filters are defined in internal standards such as DIN 45 539 (or IEC98-1964), shown below. Note that I’ve only plotted the target response. The specifications allow for some deviation of ±1 dB (except at 315 Hz). Notice that the low-pass filter is the same for both the Weighted and the Unweighted filters. Only the high-pass filter specifications are different for the two cases.
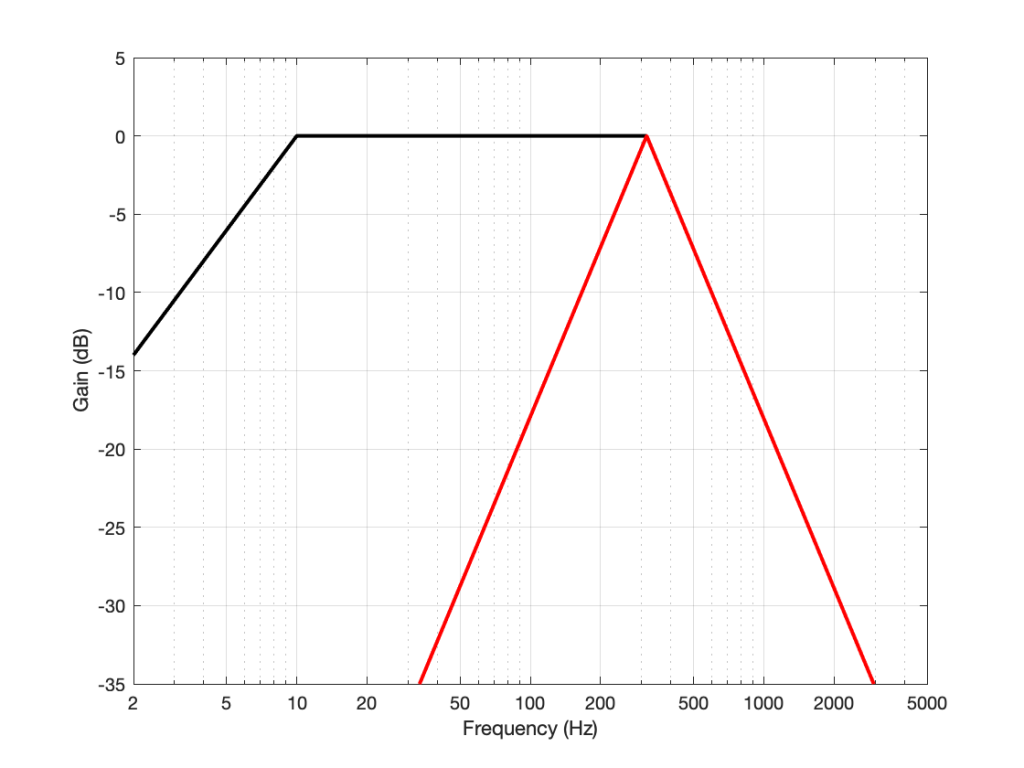
If the standard being used for the rumble measurement is the DIN 45 539 specification, then the resulting value is stated as the level difference between the measured filtered noise and a the standard output level, equivalent to the output when playing a 1 kHz tone with a lateral modulation velocity of 70.7 mm/sec. This detail is also worth noting, since it shows that the rumble value is a relative and not an absolute output level.
Rotational speed
Every recording / playback system, whether for audio or for video signals, is based on the fundamental principle that the recording and the playback happen at the same rate. For example, a film that was recorded at 24 frames (or photos) per second (FPS) must also be played at 24 FPS to avoid objects and persons moving too slowly or too quickly. It’s also necessary that neither the recording nor the playback speed changes over time.
A phonographic LP is mastered with the intention that it will be played back at a rotational speed of 33 1/3 RPM (Revolutions Per Minute) or 45 RPM, depending on the disc. (These correspond to 1 revolution either every 1.8 seconds or every 1 1/3 seconds respectively.) We assume that the rotational speed of the lathe that was used to cut the master was both very accurate and very stable. Although it is the job of the turntable to duplicate this accuracy and stability as closely as possible, measurable errors occur for a number of reasons, both mechanical and electrical. When these errors are measured using especially-created audio signals like pure sine tones, the results are filtered and analyzed to give an impression of how audible they are when listening to music. However, a problem arises in that a simple specification (such as a single number for “Wow and Flutter”, for example) can only be correctly interpreted with the knowledge of how the value is produced.
Accuracy
The first issue is the simple one of accuracy: is the turntable rotating the disc at the correct average speed? Most turntables have some kind of user control of this (both for the 33 and 45 RPM settings), since it will likely be necessary to adjust these occasionally over time, as the adjustment will drift with influences such as temperature and age.
Stability
Like any audio system, regardless of whether it’s analogue or digital, the playback speed of the turntable will vary over time. As it increases and decreases, the pitch of the music at the output will increase and decrease proportionally. This is unavoidable. Therefore, there are two questions that result:
- How much does the speed change?
- What is the rate and pattern of the change?
In a turntable, the amount of the change in the rotational speed is directly proportional to the frequency shift in the audio output. Therefore for example, if the rotational speed decreases by 1% (for example, from 33 1/3 RPM to exactly 33 RPM), the audio output will drop in frequency by 1% (so a 440 Hz tone will be played as a 440 * 0.99 = 435.6 Hz tone). Whether this is audible is dependent on different factors including
- the rate of change to the new speed
(a 1% change 4 times a second is much easier to hear than a 1% change lasting 1 hour) - the listener’s abilities
(for example, a person with “absolute pitch” may be able to recognise the change) - the audio signal
(It is easier to detect a frequency shift of a single, long tone such as a note on a piano or pipe organ than it is of a short sound like a strike of claves or a sound with many enharmonic frequencies such as a snare drum.)
In an effort to simplify the specification of stability in analogue playback equipment such as turntables, four different classifications are used, each corresponding to different rates of change. These are drift, wow, flutter, and scrape, the two most popular of which are wow and flutter, and are typically grouped into one value to represent them.
Drift
Frequency drift is the tendency of a playback device’s speed to change over time very slowly. Any variation that happens slower than once every 2 seconds (in other words, with a modulation frequency of less than 0.5 Hz) is considered to be drift. This is typically caused by changes such as temperature (as the playback device heats up) or variations in the power supply (due to changes in the mains supply, which can vary with changing loads throughout the day).
Wow
Wow is a modulation in the speed ranging from once every 2 seconds to 6 times a second (0.5 Hz to 6 Hz). Note that, for a turntable, the rotational speed of the disc is within this range. (At 33 1/3 RPM: 1 revolution every 1.8 seconds is equal to approximately 0.556 Hz.)
Flutter
Flutter describes a modulation in the speed ranging from 6 to 100 times a second (6 Hz to 100 Hz).
Scrape
Scrape or scrape flutter describes changes in the speed that are higher than 100 Hz. This is typically only a problem with analogue tape decks (caused by the magnetic tape sticking and slipping on components in its path) and is not often used when classifying turntable performance.
Measurement and Weighting
The easiest accurate method to measure the stability of the turntable’s speed within the range of Wow and Flutter is to follow one of the standard methods, of which there are many, but they are all similar. Examples of these standards are AES6-2008, CCIR 409-3, DIN 45507, and IEC-386. A special measurement disc containing a sine tone, usually with a frequency of 3150 Hz is played to a measurement device which then does a frequency analysis of the signal. In a perfect system, the result would be a 3150 Hz sine tone. In practice, however, the frequency of the tone varies over time, and it is this variation that is measured and analysed.
There is general agreement that we are particularly sensitive to a modulation in frequency of about 4 Hz (4 cycles per second) applied to many audio signals. As the modulation gets slower or faster, we are less sensitive to it, as was illustrated in the example above: (a 1% change 4 times a second is much easier to hear than a 1% change lasting 1 hour).
So, for example, if the analysis of the 3150 Hz tone shows that it varies by ±1% at a frequency of 4 Hz, then this will have a bigger impact on the result than if it varies by ±1% at a frequency of 0.1 Hz or 40 Hz. The amount of impact the measurement at any given modulation frequency has on the total result is shown as a “weighting curve” in the figure below.
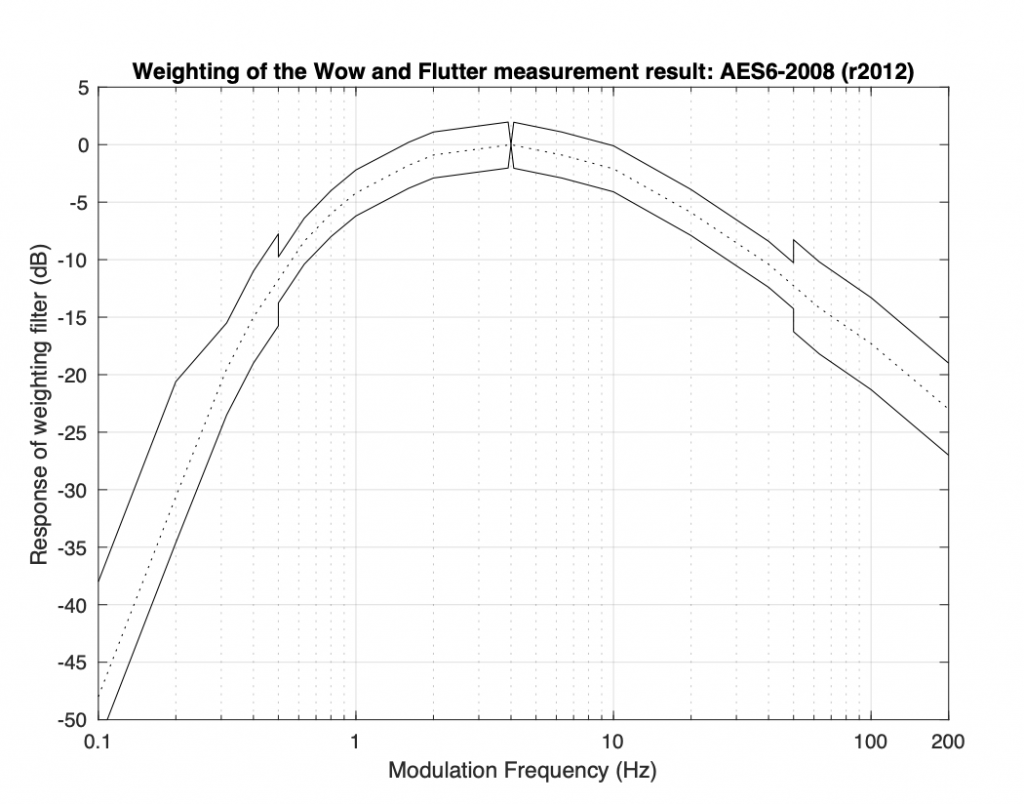
As can be seen in this curve, a modulation at 4 Hz has a much bigger weight (or impact) on the final result than a modulation at 0.315 Hz or at 140 Hz, where a 20 dB attenuation is applied to their contribution to the total result. Since attenuating a value by 20 dB is the same as dividing it by 10; a ±1% modulation of the 3150Hz tone at 4 Hz will produce the same result as a ±10% modulation of the 3150 Hz tone at 140 Hz, for example.
This shows just one example of why comparing one Wow and Flutter measurement value should be interpreted very cautiously.
Expressing the result
When looking at a Wow and Flutter specification, one will see something like <0.1%, <0.05% (DIN), or <0.1% (AES6). Like any audio specification, if the details of the measurement type are not included, then the value is useless. For example, “W&F: <0.1%” means nothing, since there is no way to know which method was used to arrive at this value.(Similarly, a specification like “Frequency Range: 20 Hz to 20 kHz” means nothing, since there is no information about the levels used to define the range.)
If the standard is included in the specification (DIN or AES6, for example), then it is still difficult to compare wow and flutter values. This is because, even when performing identical measurements and applying the same weighting curve shown in the figure above, there are different methods for arriving at the final value. The value that you see may be a peak value (the maximum deviation from the average speed), the peak-to-peak value (the difference between the minimum and the maximum speeds), the RMS (a version of the average deviation from the average speed), or something else.
The AES6-2008 standard, which is the currently accepted method of measuring and expressing the wow and flutter specification, uses a “2-sigma” method, which is a way of looking at the peak deviation to give a kind of “worst-case” scenario. In this method, the 3150 Hz tone is played from a disc and captured for as long a time as is possible or feasible. Firstly, the average value of the actual frequency of the output is found (in theory, it’s fixed at 3150 Hz, but this is never true). Next, the short-term variation of the actual frequency over time is compared to the average, and weighted using the filter shown above. The result shows the instantaneous frequency variations over the length of the captured signal, relative to the average frequency (however, the effect of very slow and very fast changes have been reduced by the filter). Finally, the standard deviation of the variation from the average is calculated, and multiplied by 2 (“2-Sigma”, or “two times the standard deviation”), resulting in the value that is shown as the specification. The reason two standard deviations is chosen is that (in the typical case where the deviation has a Gaussian distribution) the actual Wow & Flutter value should exceed this value no more than 5% of the time.
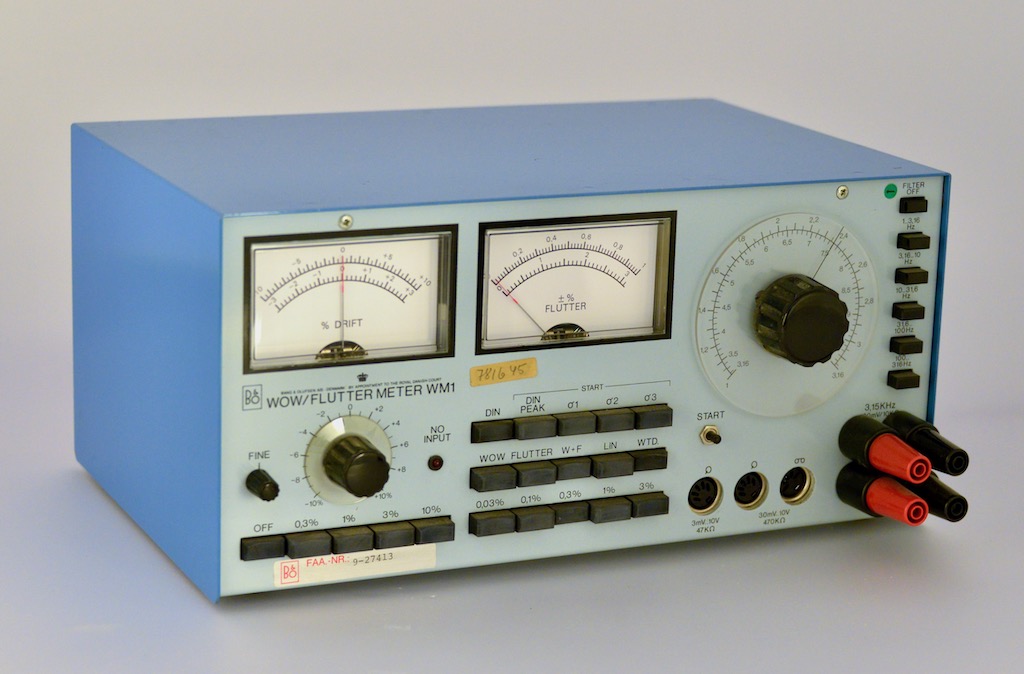
The reason this method is preferred today is that it uses a single number to express not only the wow and flutter, but the probability of the device reaching that value. For example, if a device is stated to have a “Wow and Flutter of <1% (AES6)”, then the actual deviation from the average speed will be less than 1% for 95% of the time you are listening to music. The principal reason this method was not used in the “old days” is that it requires statistical calculations applied to a signal that was captured from the output of the turntable, an option that was not available decades ago. The older DIN method that was used showed a long-term average level that was being measured in real-time using analogue equipment such as the device shown in below.
Unfortunately, however, it is still impossible to know whether a specification that reads “Wow and Flutter: 1% (AES6)” means 1% deviation with a modulation frequency of 4 Hz or 10% deviation with a modulation frequency of 140 Hz – or something else. It is also impossible to compare this value to a measurement done with one of the older standards such as the DIN method, for example.