Preface: Lincoln was right
There is a thing called “argument from authority” which is what happens when you trust someone to be right about something because (s)he knows a lot about the general topic. This is used frequently by pop-documentaries on TV when “experts” are interviewed about something. Example: “we asked an expert in underwater archeology how this piece of metal could wind up on the bottom of the ocean, covered in mud and he said ‘I don’t know’ so it must have been put there by aliens millions of years ago.” Okay, I’m exaggerating a little here, but my point is that, just because someone knows something about something, doesn’t mean that (s)he knows everything about it, and will always give the correct answers for every question on the topic.
In other words, as Abraham Lincoln once said: “Don’t believe everything you read on the Internet.”
Of course, that also means that also applies to everything that follows in the posting below (arrogantly assuming that I can be considered to be an authority on anything), so you might as well stop reading and go do something useful.
My Inspiration
There has been some discussion circulating around the Interweb lately about the question of whether the “new” trend to buy “high-resolution” audio files with word lengths of 24 bits actually provides an improvement in quality over an audio file with “only” 16 bits.
One side of this “religious” war comes from the people who are selling the high-res audio files and players. The assumed claim is that 24 bits makes a noticeable improvement in audio quality (over a “mere” 16 bits) that justifies asking you to buy the track again – and probably at a higher price.
The other side of the war are bloggers and youtube enthusiasts who write things like (a now-removed) article called “24/192 Music Downloads… and why they make no sense” (which, if you looked at the URL, is really an anti-Pono rant) and “Bit Depth & The 24 Bit Audio Myth“
Personally, I’m not a fan of religious wars, so I’d like to have a go at wading into the waters in a probably-vain attempt to clear up some of the confusion and animosity that may be caused by following religious leaders.
Some background
If you don’t know anything about how an audio signal is converted from analogue to digital, you should probably stop reading here and go check out this page or another page that explains the same thing in a different way.
Now to recap what you already know:
- An analogue to digital converter makes a measurement of the instantaneous voltage of the audio signal and outputs that measurement as a binary number on each “sample”
- The resolution of that converter is dependent on the length of the binary number it outputs. The longer the number, the higher the resolution.
- The length of a binary number is expressed in Binary digITs or BITS.
- The higher the resolution, the lower the noise floor of the digital signal.
- In order to convert the artefacts caused by quantisation error from distortion to program-dependent noise, dither is used. (Note that this is incorrectly called “quantisation noise” by some people)
- In a system that uses TPDF (Triangular Probability Distribution Function) dither, the noise has a white spectrum, meaning that is has equal energy per Hz.
A good rule of thumb in a PCM system with TPDF dithering is that the dynamic range of the system is approximately 6 * the number of bits – 3 dB. For example, the dynamic range of a 16-bit system is 6*16-3 = 93 dB. Some people will say that this is the signal-to-noise ratio of the system, however, this is only correct if your signal is always as loud as it can be.
Let’s think about what, exactly, we’re saying here. When we measure the dynamic range of a system, we’re trying to find out what the difference is (in dB) between (1) the loudest sound you can put through the system without clipping and (2) the noise floor of the system.
The goal of an engineer when making a piece of audio gear (or of a recording engineer when making a recording) is to make the signal (the music) so loud that you can’t hear the noise – but not so loud that the signal clips and therefore distorts. There are three ways to improve this: you can either (1) make your gear capable of making the signal louder, (2) design your gear so that it has less noise, or (3) both of those things. In either case, what you are trying to maximise is the ratio of the signal to the noise. In other words, relative to the noise level, you want the signal as high as possible.
However, this is a rather simplistic view of the world that has two fatal flaws:
The first problem is that (unless you like most of the music my kids like) the signal itself has a dynamic range – it gets loud and it also gets quiet. This can happen over long stretches of time (say, if you’re listening to a choral piece written by Arvo Pärt) or over relatively short periods of time (say, the difference between the sharp peak of a rim shot on a snare and the decay of a piano noise in the middle of the piece of music I’ve plotted below.)
You should note that this isn’t a piece that I use to demonstrate wide dynamic range or anything – I just started looking through my classical music collection for a piece that can demonstrate that music has loud AND quiet sections – and this was the second piece I opened (it’s by the Ahn Trio – I was going alphabetically…) So don’t make a comment about how I searched for an exceptional example of the once recording in the history of all recordings that has dynamic range. That would be silly. If I wanted to do that, I would have dug out an Arvo Pärt piece – but Arvo comes after Ahn in the alphabet, so I didn’t get that far.

The portion of this piece that I’ve highlighted in Figure 1 (the gray section in the middle) has a peak at about 1 dB below full scale, and, at the end gets down to about -46 dB below that. (You might note that there is a higher peak earlier in the piece – but we don’t need to worry about that.) So, that little portion of the music has a dynamic range of about 45 dB or so – if we’re just dumbly looking at the plot.
So, this means that we want to have a recording system and a playback system for this piece of music that has can handle a signal as loud as that peak without distorting it – but has a constant noise floor that is quiet enough that I won’t hear it at the end of that piano note decaying at the end of that little section I’ve highlighted.
What we’re really talking about here is more accurately called the dynamic range of the system (and the recording). We’re only temporarily interested in the Signal to Noise ratio, since the actual signal (the music) has a constantly varying level. What’s more useful is to talk about the dynamic range – the difference (in dB) between the constant noise of the system (or the recording) and the maximum peak it can produce. However, we’ll come back to that later.
The second problem is that the noise floor caused by TPDF dither is white noise, which means that you have equal energy per Hertz as we’ve seen before. We can also reasonably safely assume that the signal is music which usually consists of a subset of all frequencies at any moment in time (if it had all frequencies present, it would sound like noise of some colour instead of Beethoven or Bieber), that are probably weighted like pink noise – with less and less energy in the high frequencies.
In a worst-case situation, you have one note being played by one instrument and you’re hoping that that one note is going to mask (or “drown out”) the noise of the system that is spread across a very wide frequency range.
For example, let’s look again at the decay of that piano note in the example in Figure 1. That’s one note on a piano, dropping down to about -40-something dB FS, with a small collection of frequencies (the fundamental frequency of the pitch and its multiples), and you’re hoping that this “signal” is going to be able to mask white noise that stretches in frequency band from something below 20 Hz all the way up past 20 kHz. This is worrisome, at best.
In other words, it would be easy for a signal to mask a noise if the signal and the noise had the same bandwidth. However, if the signal has a very small bandwidth and the noise has a very wide bandwidth, then it is almost impossible for the signal to mask the noise.
In other words, the end of the decay of one note on a piano is not going to be able to cover up hiss at 5 kHz because there is no content at 5 kHz from the piano note to do the covering up.
So, what this means is that you want a system (either a recording or a piece of audio gear) where, if you set the volume such that the peak level is as loud as you want it to be, the noise floor of the recording and the playback system is inaudible at the listening position. (We’ll come back to this point at the end.) This is because the hope that the signal will mask the noise is just that – hope. Unless you listen to “music” that has no dynamic range and is constantly an extremely wide bandwidth, then I’m afraid that you may be disappointed.
One more thing…
There is another assumption that gets us into trouble here – and that is the one I implied earlier which says that all of my audio gear has a flat magnitude response. (I implied it by saying that we can assume that the noise that we get is white.)
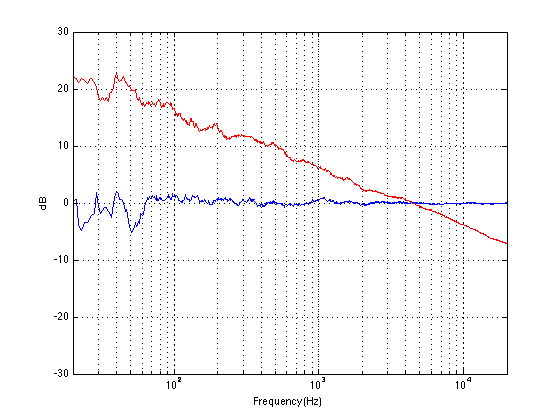
Let’s look at the magnitude response of a pair of earbud headphones that millions and millions of people own. I borrowed this plot from this site – but I’m not telling you which earbuds they are – but I will say that they’re white. It’s the top plot in Figure 2.

This magnitude response is a “weighting” that is applied to everything that gets into the listener’s ears (assuming that you trust the measurement itself). As you can see if you put in a signal that consists of a 20 Hz tone and a 200 Hz tone that are equal in level, then you’ll hear the 200 Hz tone about 40 dB louder than the 20 Hz tone. Remember that this is what happens not only to the signal you’re listening to, but also the noise of the system and the recording – and it has an effect.
For example, if we measure a 16-bit linear PCM digital system with TPDF dithering, we’ll see that it has a 93.3 dB dynamic range. This means that the RMS level of a sine wave (or another signal) that is just below clipping the system (so it’s as loud as you can get before you start distorting) is 93.3 dB louder than the white noise noise floor (yes, the repetition is intentional – read it again). However, that is the dynamic range if the system has a magnitude response that is +/- 0 dB from 0 Hz to half the sampling rate.
If, however, you measured the dynamic range through those headphones I’m talking about in Figure 2, then things change. This is because the magnitude response of the headphones has an effect on both the signal and the noise. For example, if the signal you used to measure the maximum capabilities of the system were a 3 kHz sine tone, then the dynamic range of the system would improve to about 99 dB. (I measured this using the filter I made to “fake” the magnitude response – it’s shown in the bottom of Figure 2.)
Remember that, with a flat magnitude response, the dynamic range of the 16-bit system is about 93 dB. By filtering everything with a weird filter, however, that dynamic range changes to 99 dB IF THE SIGNAL WE USE TO MEASURE THE SYSTEM IS a 3 kHz SINE TONE.
The problem now is that the dynamic range of the system is dependent on the spectrum of the signal we use to measure the peak level with – which will also be true when we consider the signal to noise ratio of the same system. Since the spectrum of the music AND the dither noise are both filtered by something that isn’t flat, the SNR of the system is dependent on the frequency content of the music and how that relates to the magnitude response of the system.
For example, if we measured the dynamic range of the system shown above using sine tones at different frequencies as our measurement signal, we would get the values shown in Figure 3

If you’re looking not-very-carefully-at-all at the curve in Figure 3, you’ll probably notice that it’s basically the curve on the bottom of Figure 2, upside down. This makes sense, since, generally, the filter will attenuate the total power of the noise floor, and the signal used to make the dynamic range measurement is a sine wave whose level is dependent on the magnitude response. What this means is that, if your system is “weak” at one frequency band, then the signal to noise ratio of the system when the signal consists of energy in the “weak” band will be worse than in other bands.
Another way to state this is: if you own a pair of those white earbuds, and you listen to music that only has bass in it (say, the opening of this tune) you might have to turn up the level so much to hear the bass that you’ll hear the noise floor in the high end.
Wrapping up
As I said at the beginning, some people say “more bits are better, so you should buy all your music again with 24-bit versions of your 16-bit collection”. Some other people say “24-bits is a silly waste of money for everyone”.
What’s the truth? Probably neither of these. Let’s take a couple of examples to show that everyone’s wrong.
Case 1: You listen to music with dynamic range and you have a good pair of loudspeakers that can deliver a reasonably high peak SPL level. You turn up the volume so that the peak reaches, say, 110 dB SPL (this is loud for a peak, but if it only happens now and again, it’s not that scary). If your recording is a 16-bit recording, then the noise floor is 93 dB below that, so you have a wide-band noise floor of 17 dB SPL which is easily audible in a quiet room. This is true even when the acoustic noise floor of the room is something like 30 dB SPL or so, since the dither noise from the loudspeaker has a white noise characteristic, whereas acoustic background noise in “real life” is usually pink in spectrum. So, you might indeed hear the high-frequency hiss. (Note that this is even more true if you have a playback system with active loudspeakers that protect themselves from high peaks – they’ll reduce the levels of the peaks, potentially causing you to push up the volume knob even more, which brings the noise floor up with it.)
Case 2: You have a system with a less-than-flat magnitude response (i.e. a bass roll-off) and you are listening to music that only has content in that frequency range (i.e. the bass), so you turn up the volume to hear it. You could easily hear the high-frequency noise content in the dither if that high frequency is emphasised by the playback system.
Case 3: You’re listening to your tunes that have no dynamic range (because you like that kind of music) over leaky headphones while you’re at the grocery store shopping for eggs. In this case, the noise floor of the system will very likely be completely inaudible due to the making by the “music” and the background noise of announcements of this week’s specials.
The Answer
So, hopefully I’ve shown that there is no answer to this question. At least, there is no one-size-fits-all answer. For some people, in some situations, 16 bits are not enough. There are other situations where 16 bits is plenty. The weird thing that I hope that I’ve demonstrated is that the people who MIGHT benefit from higher resolution are not necessarily those with the best gear. In fact, in some cases, it’s people with worse gear that benefit the most…
… but Abraham Lincoln was definitely right. Stick with that piece of advice and you’ll be fine.
Appendix 1: Noise shaping
One of the arguments against 24-bit recordings is that a noise-shaped 16-bit recording is just as good in the midrange. This is true, but there are times when noise shaping causes playback equipment some headaches, since it tends to push a lot of energy up into the high frequency band where we might be able to hear it (at least that’s the theory). The problem is that the audio gear is still trying to play that “signal”, so if you have a system that has issues, for example, with Intermodulation Distortion (IMD) with high-frequency content (like a cheap tweeter, as only one example) then that high-frequency noise may cause signals to “fold down” into audible bands within the playback gear. So noise shaping isn’t everything it’s cracked up to be in some cases.