B&O Tech: Loudspeaker Development Process

#4 in a series of articles about the technology behind Bang & Olufsen loudspeakers


This week we’ll look at how most loudspeakers in the Bang & Olufsen go from the original idea through to the final product. I’ll use the BeoSound 8 (nowadays called the BeoPlay A8) as an example of this development process. However, the process itself is almost identical for almost all of our products.


The concept

The first step with most (but certainly not all) of our loudspeakers is an idea from either a designer or someone from our product definition department. They’ll come to the acoustics department with an idea of the product concept. This includes things like the following

  • what kind of loudspeaker is it? (i.e. a docking station, a “bookshelf” loudspeaker, a floor-standing loudspeaker, etc.)
  • the target customer and usage
  • the target price
  • a rough idea of the size and shape


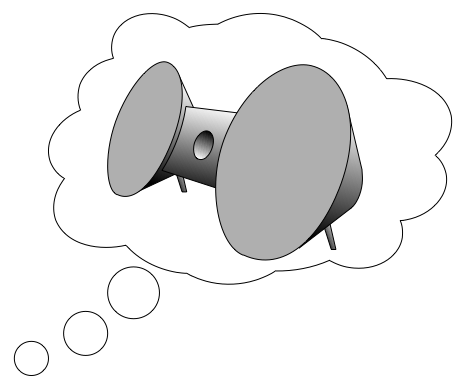
The original idea in the head of the designer.

From there, the acoustics engineer for the project can start looking into what kind of hardware we should use for the project. For example, this means things like:

  • how many loudspeaker drivers (i.e. is it a single “full range” driver, a 2-way, a 3-way or something else?)
  • loudspeaker driver dimensions (i.e. diameters and depths)
  • how much volume we have in the enclosure behind the driver(s)

Based on this, we get a “best guess” of what kind of  system we’re looking at – at least with respect to the acoustics. At this point, if the acoustic engineer thinks that it’s a feasible concept, then we’ll move on to building a first prototype. If not, then we’ll enter into meetings with the product definition and design people to start working out the issues. However, for this story, let’s assume that all is well, and we can keep moving on.


Prototype #1

In order to get some idea of the acoustic performance of the system (basically meaning “can it play bass loudly enough?”) a first prototype is constructed. This is almost always a box made of MDF with a reasonable guess of the internal enclosure volume. Typically, at this point, we’ll use some off-the-shelf loudspeaker drivers that have roughly the same size and characteristics as what we’ll need in the product. In the case of the BeoSound 8, that first prototype looks like the one shown in the photo below. This prototype looks like it’s one box, but there is a bulkhead separating the two volumes behind the woofers.
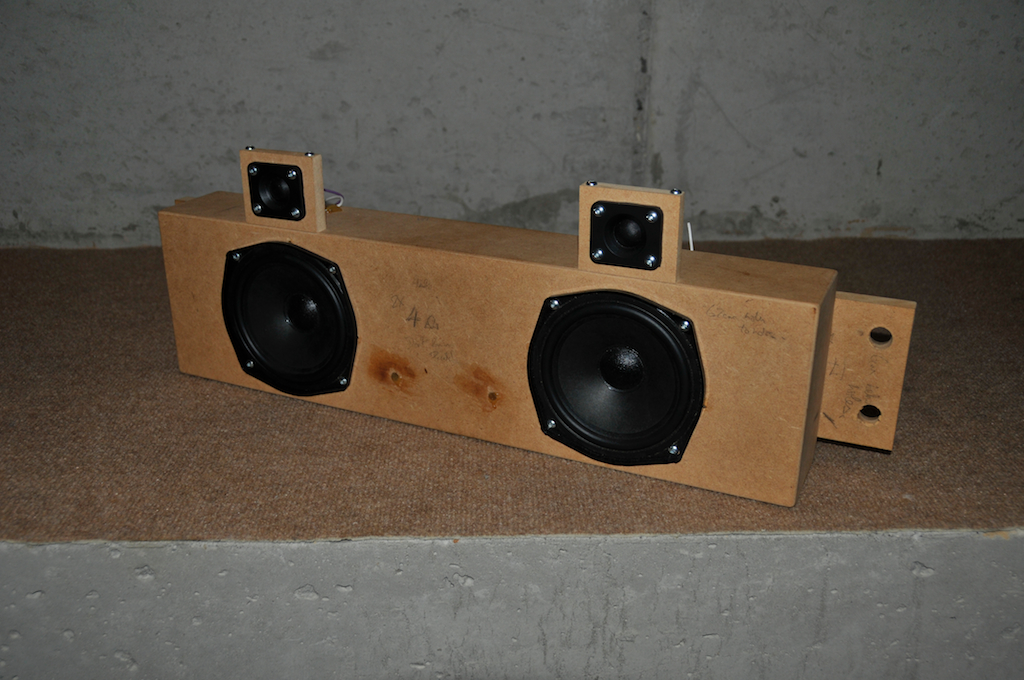
 

Prototype #1 - the best guess of driver size and cabinet volume based on the designer's ideas.
Prototype #1 – the best guess of driver sizes and cabinet volumes based on the designer’s ideas.


Note that, at this point, we are only considering the acoustic capabilities of the prototype. So, we won’t spend a lot of time tuning it, since there won’t be a lot of listening done to it. A rough tuning is done to clean up the serious problems, but the question being asked at this point is something like “do we have the hardware that can deliver a sound performance that we can work with?” If we were building a car, this would be like having the engine on a test block, checking to see if we are going to get the necessary horsepower out of it – we wouldn’t be taking it out for a drive yet.

So, we do a rough tuning of the prototype, have a quick listen, do some measurements and see if we’re in the ballpark – do we have a “go” or a “no go”? If it’s a “go” then we move on.

One of the big problems with Prototype #1 is that it doesn’t have the same shape as the final product. So, although we can use filtering to make this loudspeaker have the magnitude response we want in one direction – typically on-axis (which is usually, but not always, directly in front of the loudspeaker), it will not have the same off-axis or power response of the final product. This is because the off-axis and power responses of a loudspeaker are primarily determined by the physical shape of the loudspeaker itself. (For a slightly more detailed discussion of this, read this.) If the final loudspeaker is going to have a circular face, and the prototype is a rectangle, then we have no idea how the final product will behave. This is one of the big reasons why we don’t bother tuning Prototype #1 very carefully, since the off-axis and power responses are significant components in the overall “sound” of a loudspeaker. So, we have to build Prototype #2 which is shaped a little more like the final product.


Prototype #2

The second prototype, shown below, looks more like the final product – particularly in the shape of the “baffle” – an acoustical word meaning “the face of the loudspeaker where the drivers are mounted”. You can see that this prototype now has circular faces with a sharp angle between the front and the side/back of the enclosure. This shape has a very different acoustic effect (to be more precise, “diffraction” – but that’s a topic for a future posting) than the smoothed right angle in the MDF box in Prototype #1. So, with this prototype, we can get a much better idea of the off-axis and power responses of the final product. If we see something really problematic at this point, we enter into negotiations with the designer, since it means we are going to ask him or her to change the shape of the loudspeaker.
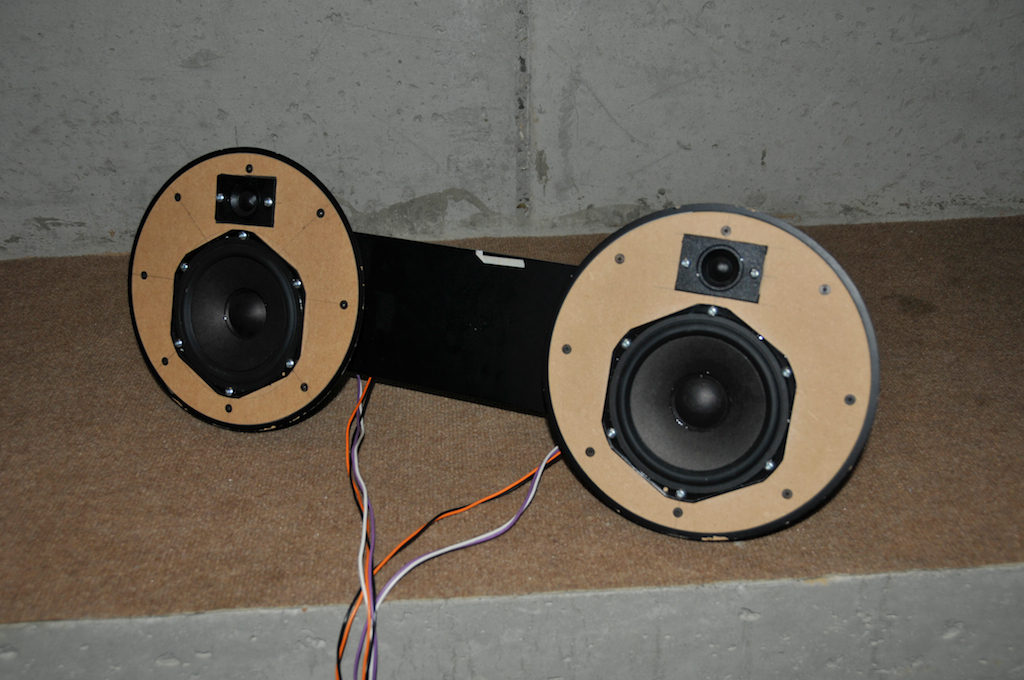
 

Prototype #2 (front) - Some changes have been made to the drivers, and the baffle shape is more like the "real thing"
Prototype #2 (front) – Some changes have been made to the drivers, and the baffle shape is more like the “real thing”

You’ll also notice in this photograph that the tweeter and the woofer have changed since Prototype #1. This may be either because we found out that there is another off-the-shelf driver available that better suits the requirements of the product – or it’s because we have gone to the manufacturer of the driver to get changes made to the device to make it better suited to the application. (This wouldn’t be surprising, since most drivers are not designed to be put in enclosures as small as the ones we use. In fact, most of our loudspeakers have loudspeaker drivers that have been customised for us specifically for the requirements of the finished products.)

Looking at the back side of the prototype in the photo below, you can see 8 wires coming out. There are two wires connected to each driver, and there are four drivers – two woofers and two tweeters. When we’re measuring or listening to the loudspeaker, these are connected to external amplifiers. Early in the process, we’ll use large, rack-mounted professional amplifiers, but as we get further through the development we’ll start using amplifiers that are more like the the final hardware.
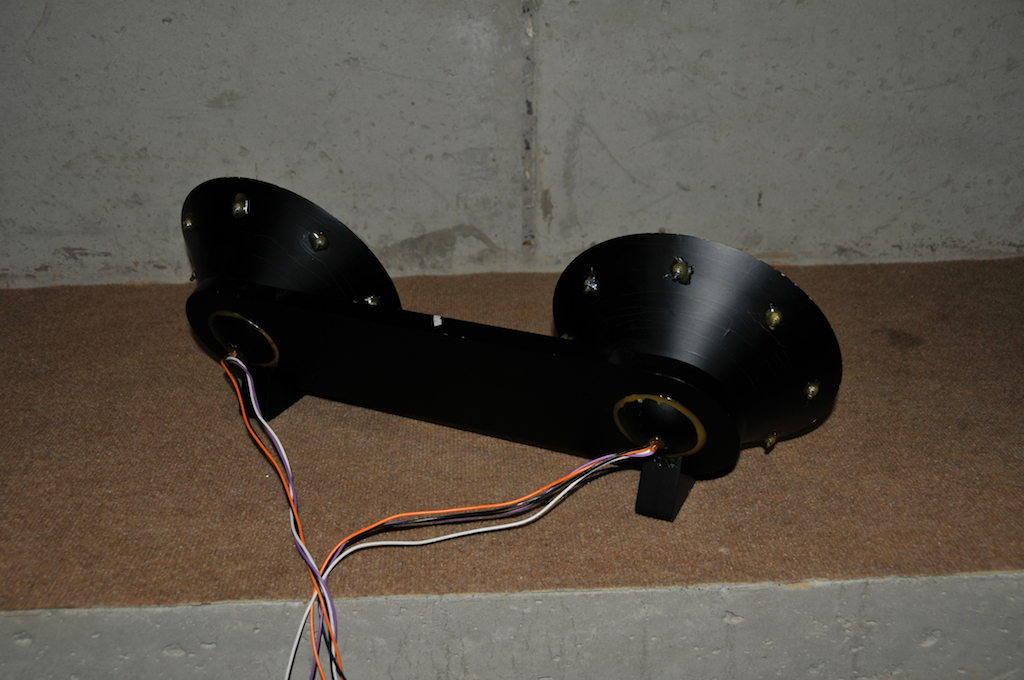
Prototype #2 - back view
Prototype #2 – back view

Prototype #3

So far so good. This time, the changes are more evolutionary than revolutionary. We get some more changes made to the drivers, and we make a model that is even more similar to the final shape of the product. If you look carefully at the difference between the second and third prototypes, you can see that the drivers have moved slightly. In Prototype #2, they were directly centred in the circular front, however, in Prototype #3, they’ve shifted slightly. Depending on the product, this might be due to acoustical reasons, but it could also be due to other reasons, such as the necessity to make space for components (like printed circuit boards) inside the enclosure.

As you can see in the photo, Prototype #3 doesn’t have any MDF parts – actually this one was milled out of a block of plastic. However, these days, we don’t do that any more, we use 3D printers. Unfortunately, we can’t start to do a detailed tuning of the loudspeaker yet, since the plastic that we used to use in the old days for milling and the plastic that comes out of a 3D printer is different from the plastic that gets used in the final product. As a result, the vibrations from the cabinet (for example) will be different in this prototype than in the final version. And, since a part of the final tuning is compensating for vibrations in the loudspeaker cabinet, there’s no point in tuning yet.
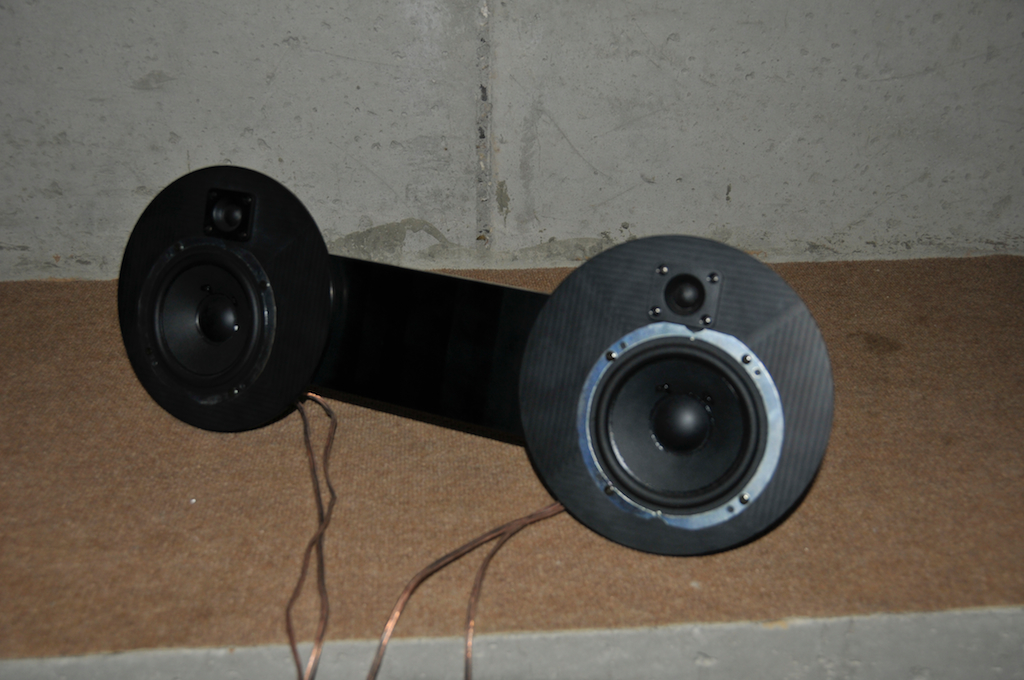
 

Prototype #3 - getting closer to the final shape. This is made out of a milled block of plastic, but these days we would be more likely to use a 3D printer instead.
Prototype #3 – getting closer to the final shape. This is made out of a milled block of plastic, but these days we would be more likely to use a 3D printer instead.


A funny side-story here. During the actual development of the BeoSound 8, we were doing a test on a prototype that looked exactly like this one (well, not exactly, it was grey…) in the Cube. It was sitting on a small platform on the crane (which hangs from the ceiling), about 6 m off the floor. The test was called a “bass capability” measurement where we put low-frequency tones into the loudspeaker at increasing levels until we reach a pre-determined amount of distortion. Then the frequency is changed and the test is repeated. Well, the test was running, and from the control room, you could hear a “boooooop … boooooop … boooooop … boooo ……… crash” Well, it turned out that the loud low frequency tones caused the prototype to slowly hop along the platform until it went over the edge and crashed on the floor. There wasn’t much left of it, so we had the black one made.

Again, as you can see in the photo below, we’re still using external amplifiers to drive the loudspeaker for measurements and listening.
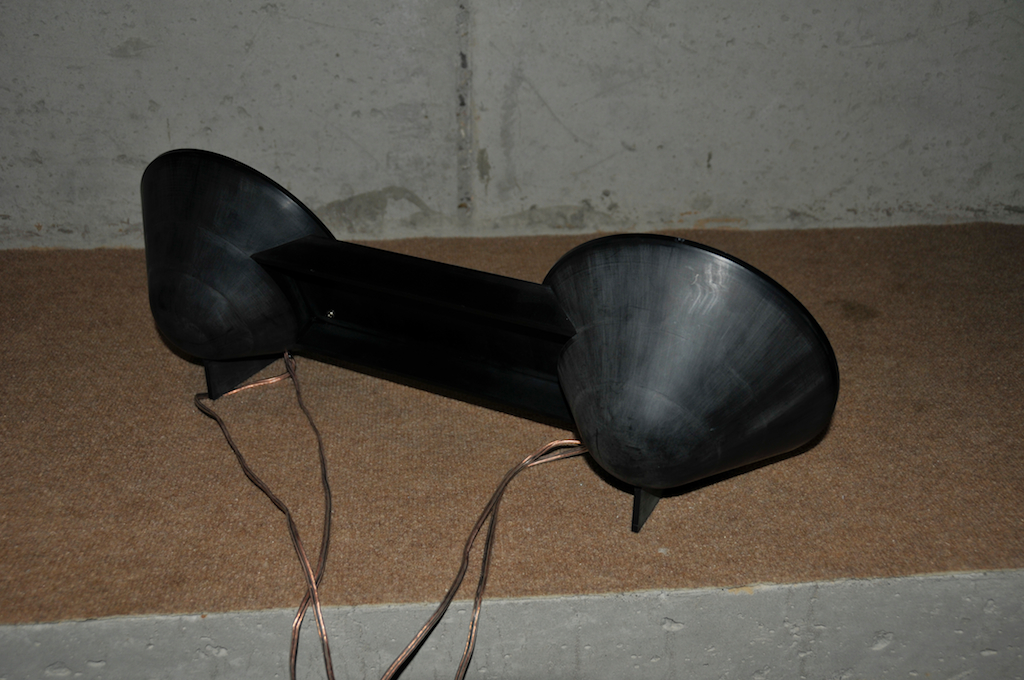
Prototype #3 - back view
Prototype #3 – back view


In the next two photos below, you can see the prototype on the crane in the cube.  You’ll notice, particularly in the first photo, that it’s securely clamped to a block of aluminium, which is also clamped to the crane itself. We wouldn’t want it to fall off and crash to the floor, now, would we?
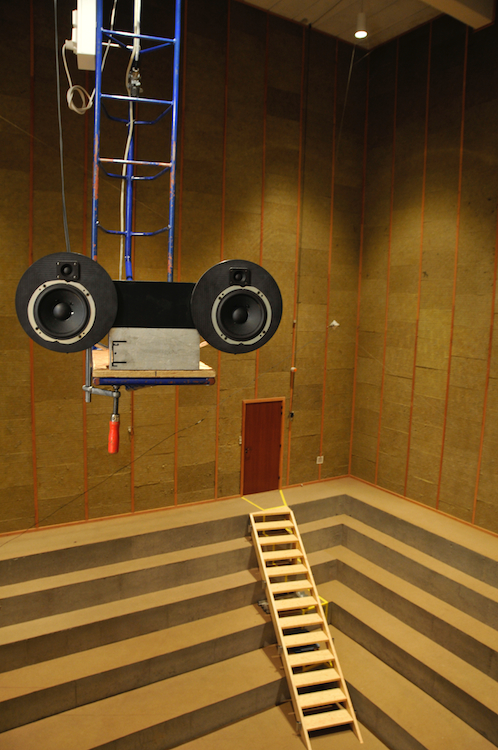
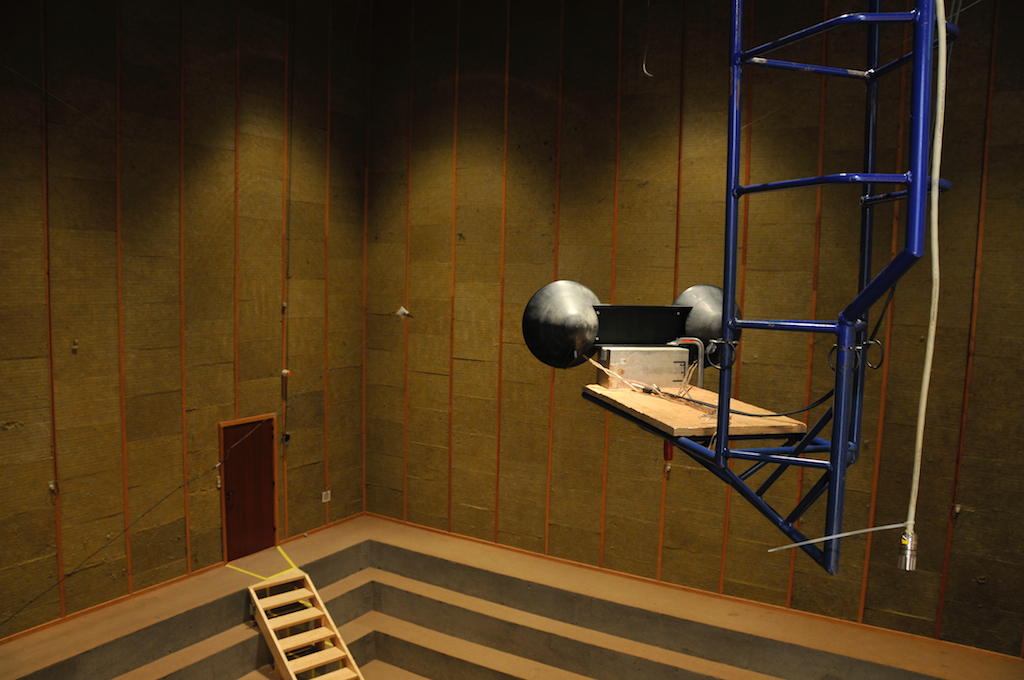
 

Prototype #3 on the crane in the Cube, about to be measured
Prototype #3 on the crane in the Cube, on its way out to the middle of the room to be measured


Prototype #3 on the crane in the Cube. The microphone is visible in the distance. It's at the end of a slender tube held in place by a white pyramid.
Prototype #3 on the crane in the Cube. The microphone is visible in the distance. It’s at the end of a slender tube held in place by a white pyramid. It’s suspended at the centre of the room by wires that run diagonally, floor to ceiling.


Prototype #4

At this point, we’re getting really close to the end. The production line is being set up, with the machinery being made to build the components in the product. So, we start looking at the early models that are coming off the production line. This means that we’re testing a product that is very close to being the final product, but it also means that we’re “de-bugging” the production line itself. This is why the prototype shown in the photo below looks like the final product – but it really isn’t.
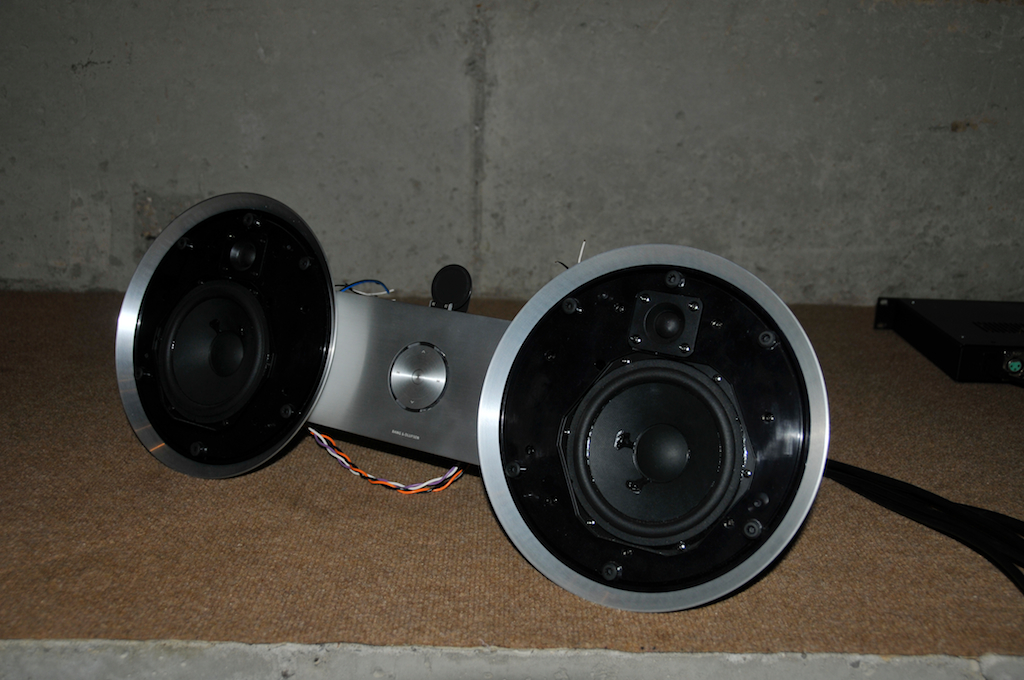
 

Prototype #4 - this looks like the final version, but this does not work at all. It needs external amplifiers and DSP for the signals.
Prototype #4 – this looks like the final version, but this does not work at all. It needs external amplifiers and DSP for the signals.


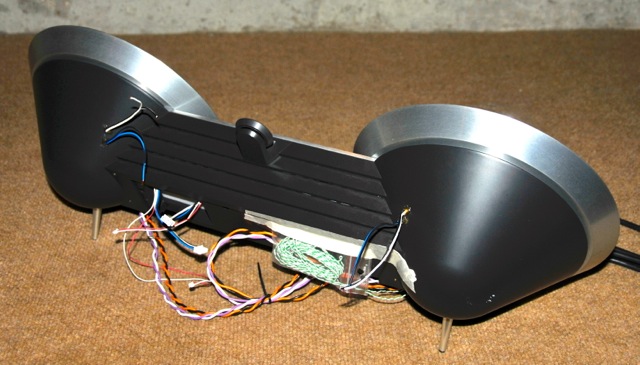
If you take a look at the photo below, you can see that we still have lots of wires having out of the back of the loudspeaker. Some of these are connected to the loudspeaker drivers themselves, because we’re still driving them with external amplifiers. However, there are a lot more wires there. The extra wires are connected to thermal sensors. We’ll come back to those later.
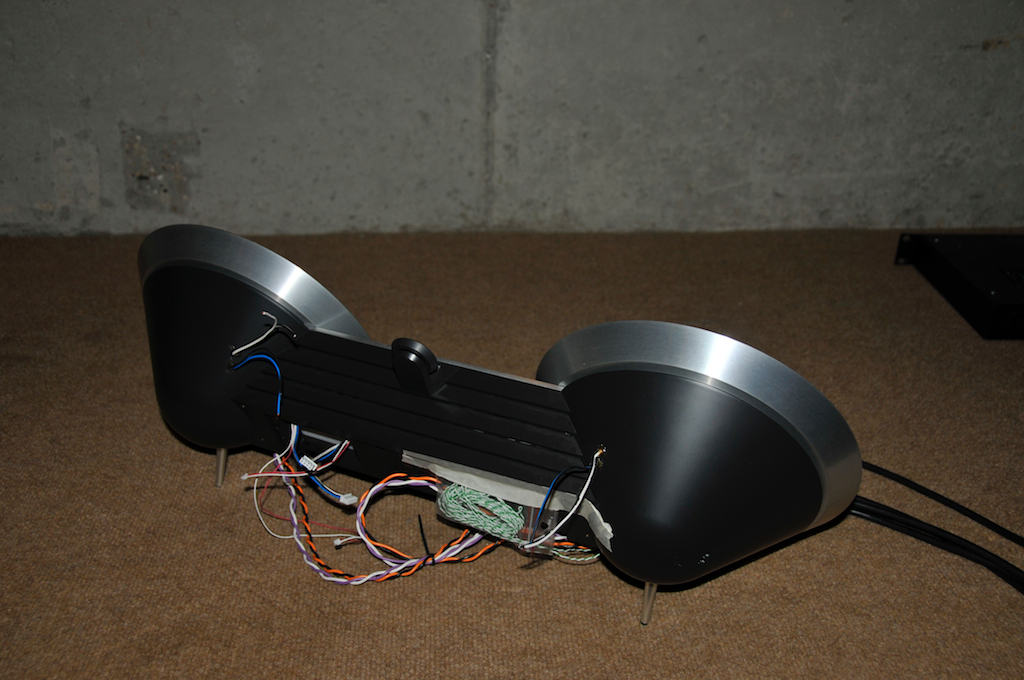
 

Prototype #4 - back view. From here you can see the wires to the woofers and tweeters, but also many more which lead to thermal sensors inside.
Prototype #4 – back view. From here you can see the wires to the woofers and tweeters, but also many more which lead to thermal sensors inside.


Since this prototype is basically acoustically identical to the final product, we can start working on the sound design of the loudspeaker. This is a three-step process, consisting of listening, measuring, and listening.

Step 1 is to ensure that the loudspeaker doesn’t suffer from any problems with something called rub & buzz. When a woofer moves in and out of a loudspeaker cabinet, there is a considerable amount of vibration sent through the system, either because the woofer is mechanically connected to the rest of the system or because of the large changes in pressure inside the loudspeaker enclosure. If there are any leaks in the cabinet or if two parts can rub together inside, then these vibrations will cause buzzing (which can sound a lot like distortion) at very specific frequencies. These are usually so bad that, if they aren’t fixed, we can’t measure the acoustical response of the loudspeaker. So, these problems get fixed by hand by using stuff like glue, felt, or foam weather stripping. There are two good things about this: the first is that we get a well-performing prototype that we can work with. The second is that we learn what needs to be fixed on the production line to avoid these problems in the final products.

Step 2 is to measure the loudspeaker in the Cube (a 12m x 12m x 13m room) to see how it behaves both in the frequency domain (i.e. what does its magnitude response look like) and the time domain (i.e. when you send in an impulse, are any frequencies ringing longer than others). The acoustical engineer and the DSP engineer work together at this point to look at the measurements and firstly determine whether any physical changes are needed in the loudspeaker to correct problems in its acoustical response. Once these problems are corrected, the difference between the desired response of the loudspeaker and the actual response of the loudspeaker is analysed. That analysis is used to build a filter that reduces the difference so that the we get the desired response from the loudspeaker – at least according to the measurements. For example, if the loudspeaker has too little bass and a bump in its response at 2 kHz, then we will boost the bass and put in a dip at 2 kHz. I’ll go into a lot more detail about this in a future posting.

Step 3 is to listen. The loudspeaker with its corrective filter is brought into the listening room and we start playing music through it. We don’t start fiddling with equalisation right away. The first thing to do is to listen for problems that don’t show up in the measurements. If we detect any problems in the listening room, then we go back to the measurements to see if we can find out why something sounds weird. This puts us in a loop of listen – find problem – fix problem – listen some more – etc. until we run out of problems with physical solutions. Finally, we start listening to music and equalising to get the loudspeaker to sound as we want it (whatever that means). So, we go into the listening room and do this (this usually takes between 3 and 5 days if all goes well). Then we go to a different room (like, say, my living room at home, for example) and start tuning from scratch again. This process of tuning in a room is done in 4 or 5 rooms, resulting in one tuning filter for each room (usually I wind up with between 20 and 40 equalisers for a typical loudspeaker in each room). The problem here is that some of the filters that get put in to clean up the sound of a loudspeaker in a room are actually to correct problems in the room – not the loudspeaker. This is why we do the tuning in more than one room – the different tunings are taken and only the corrections that are common to more than one room are implemented. (For example, we have a room mode at 55 Hz in the main listening room at B&O – so I’ll put in a filter at 55 Hz to reduce that problem when I’m tuning in that room. However, since your living room does not necessarily have a mode at 55 Hz, then that correction should not be part of the loudspeaker.)
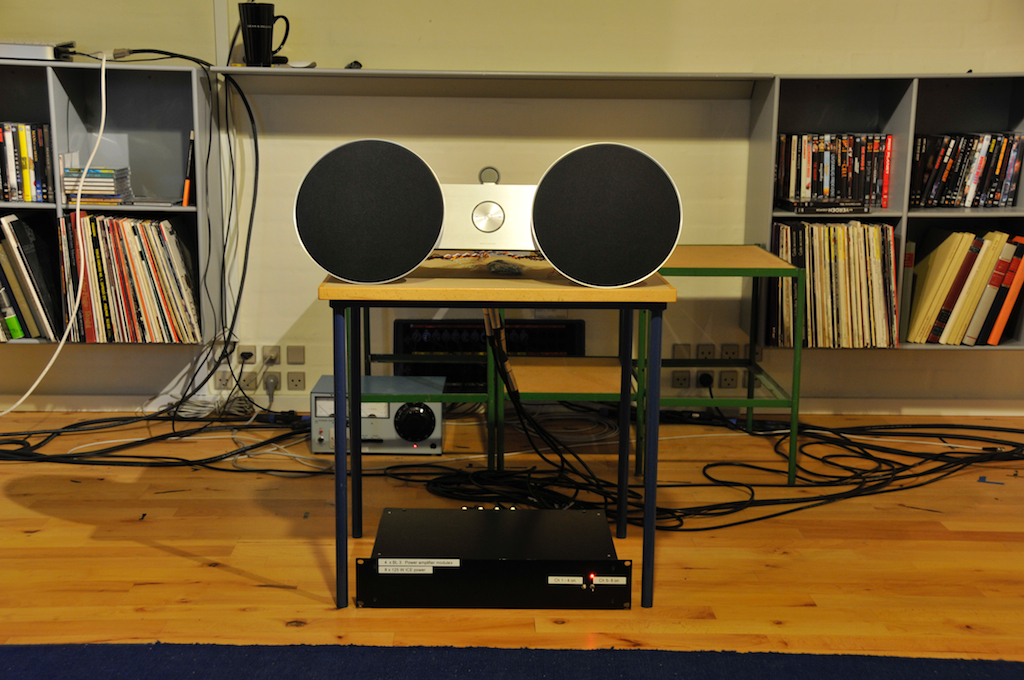
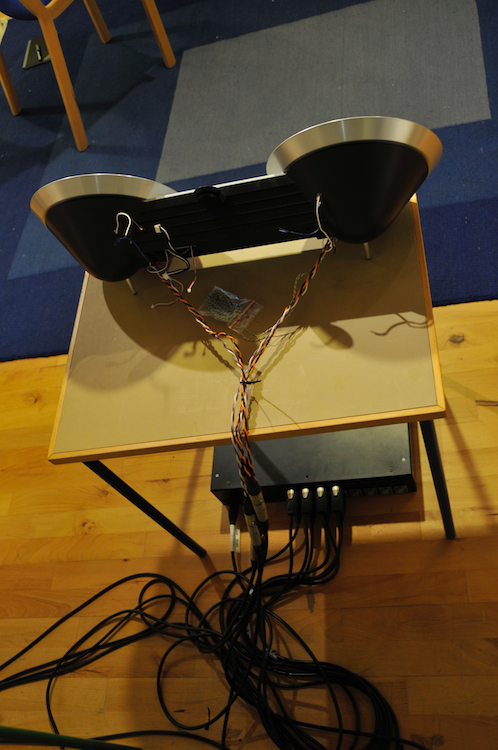
Prototype #4 in Listening Room 1 during the final sound design process
Prototype #4 in Listening Room 1 during the final sound design process. The box on the floor contains 8 channels of amplifiers (although, for this product, we’re only using 4 of those channels).


Prototype #4 in Listening Room 1 during the final sound design process. Note the wires running down to the external amplifier.


After the sound design has been finalised, then there are three more things left to do.

Firstly, the filters for the position switch (free / wall / corner) need to be tuned (using measurements from the Cube) and verified (by listening to music in different positions in different rooms).

Secondly, the final thermal tests have to be performed. For this, we connect the outputs of the thermal sensors (seen in one of those photos above) to a computer and we start playing some techno music really loudly, and we go home for the weekend. When we get back, we have a log file on a computer that tells us how hot the various components got and how that related to the music that we were playing. This tells us how close the loudspeaker components will get to their thermal limits in real life. Using this data, we can program the DSP to not allow the loudspeaker that you purchase to get hotter than it should. This was explained (sort of) in a previous posting.

Finally, we program a bunch of early production models with the “final” software and send them home with various people in the company for “real world” testing.

Production models

Once the production starts for real, we get the first samples that come off the line so that we can measure and test them to ensure that their performance and sound matches the prototypes that we worked on. Sometimes this doesn’t just mean putting the production model in the cube – sometimes it means something a little more customised. For example, for the BeoSound 8, we had to build a custom test rig and software to ensure that the fabric on the grilles was properly attached to the plastic backing. You can see the prototype of this test setup in the photo below.
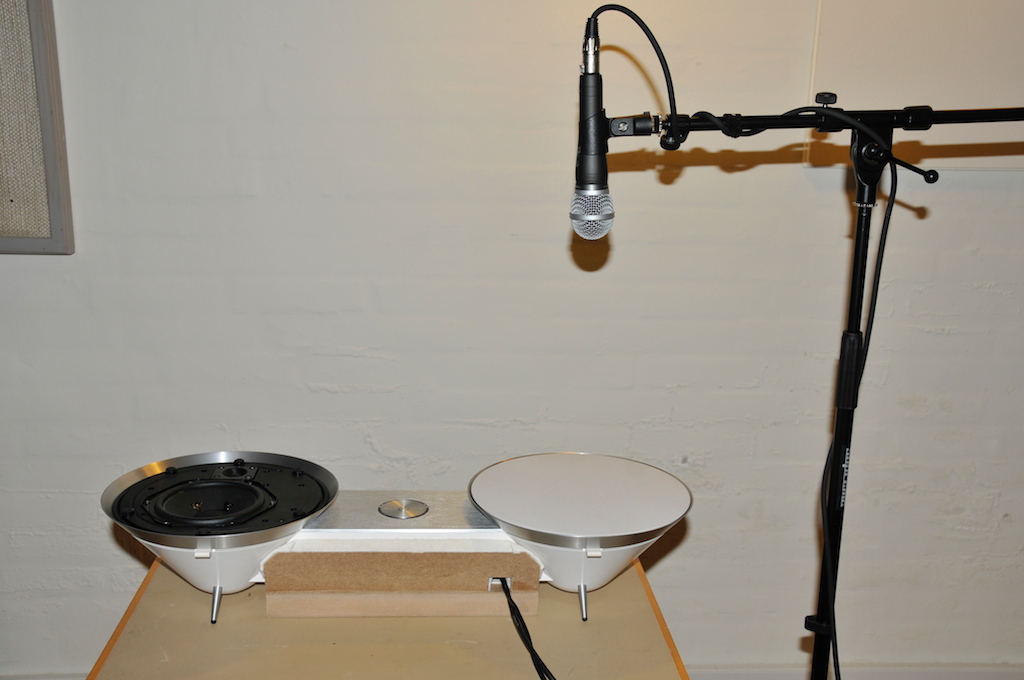
 

A final production model of the BeoSound 8 with one of the early grilles. This is the prototype version of the test rig used to ensure that the fabric was glued properly to the grilles.
A final production model of the BeoSound 8 with one of the early grilles. This is part of the prototype version of the test rig used to ensure that the fabric was properly attached to the plastic grilles.


Finally, we’re done! We sign off the production models and give the go-ahead to start shipping to the dealers.

The final version on one of the original marketing shots.


Of course, the story I’ve told above is sort of skipping over a lot of details – but I’ll fill in some of those holes (at least partially) in future postings.
B&O Tech: The naked truth

#3 in a series of articles about the technology behind Bang & Olufsen loudspeakers


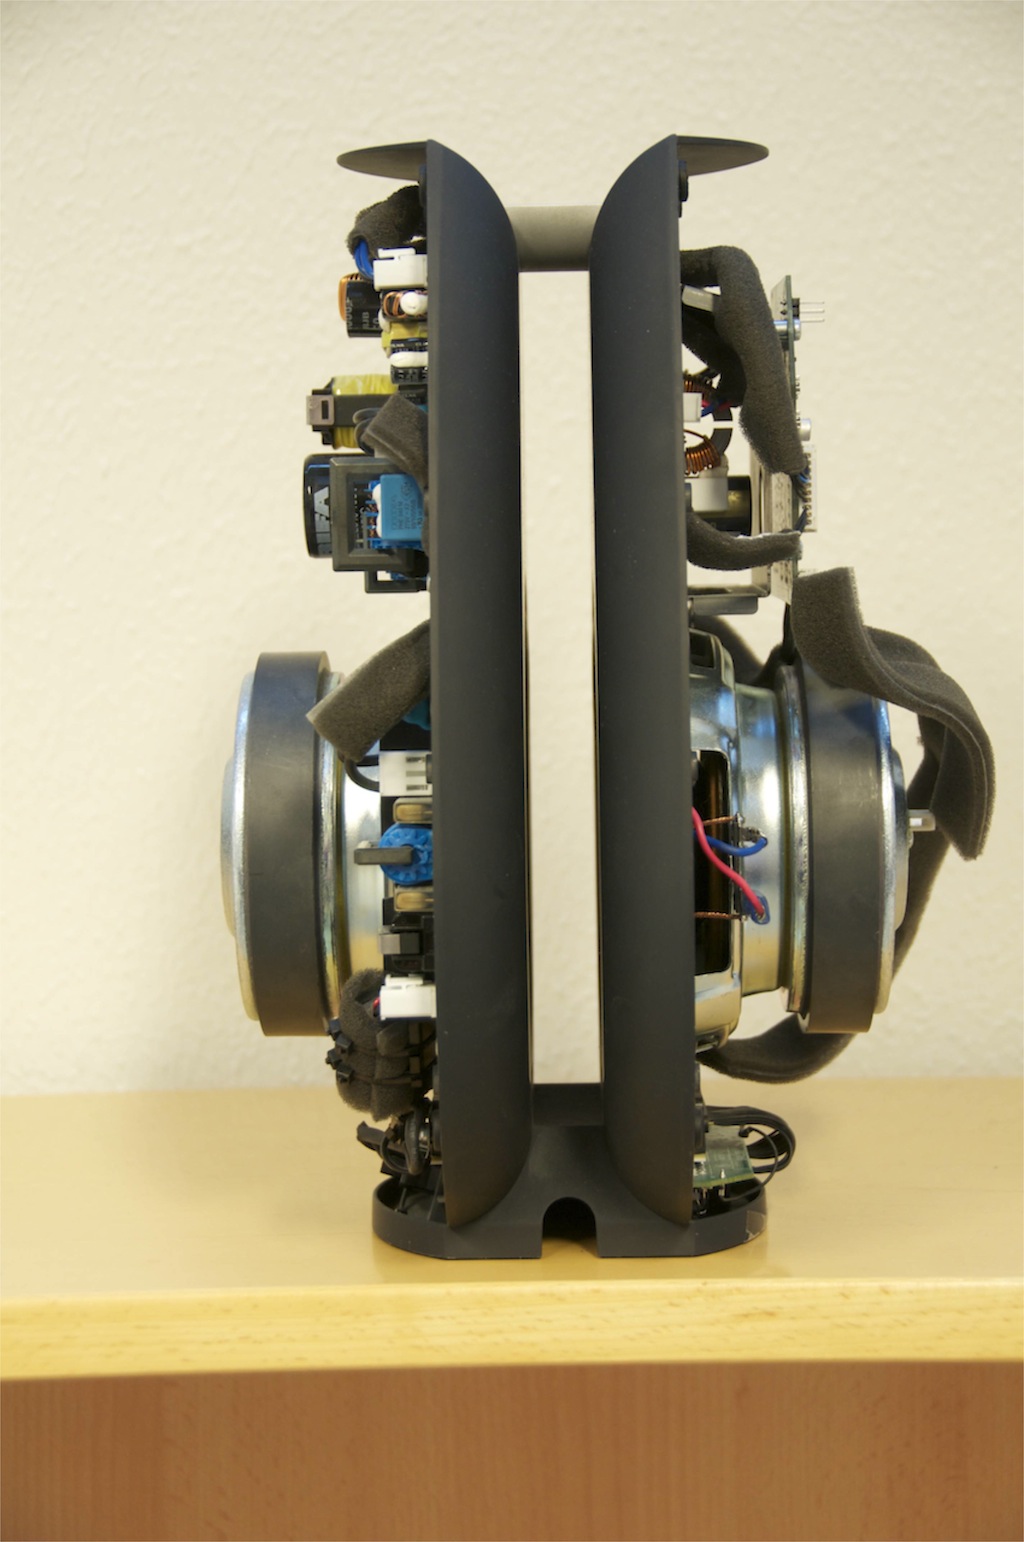
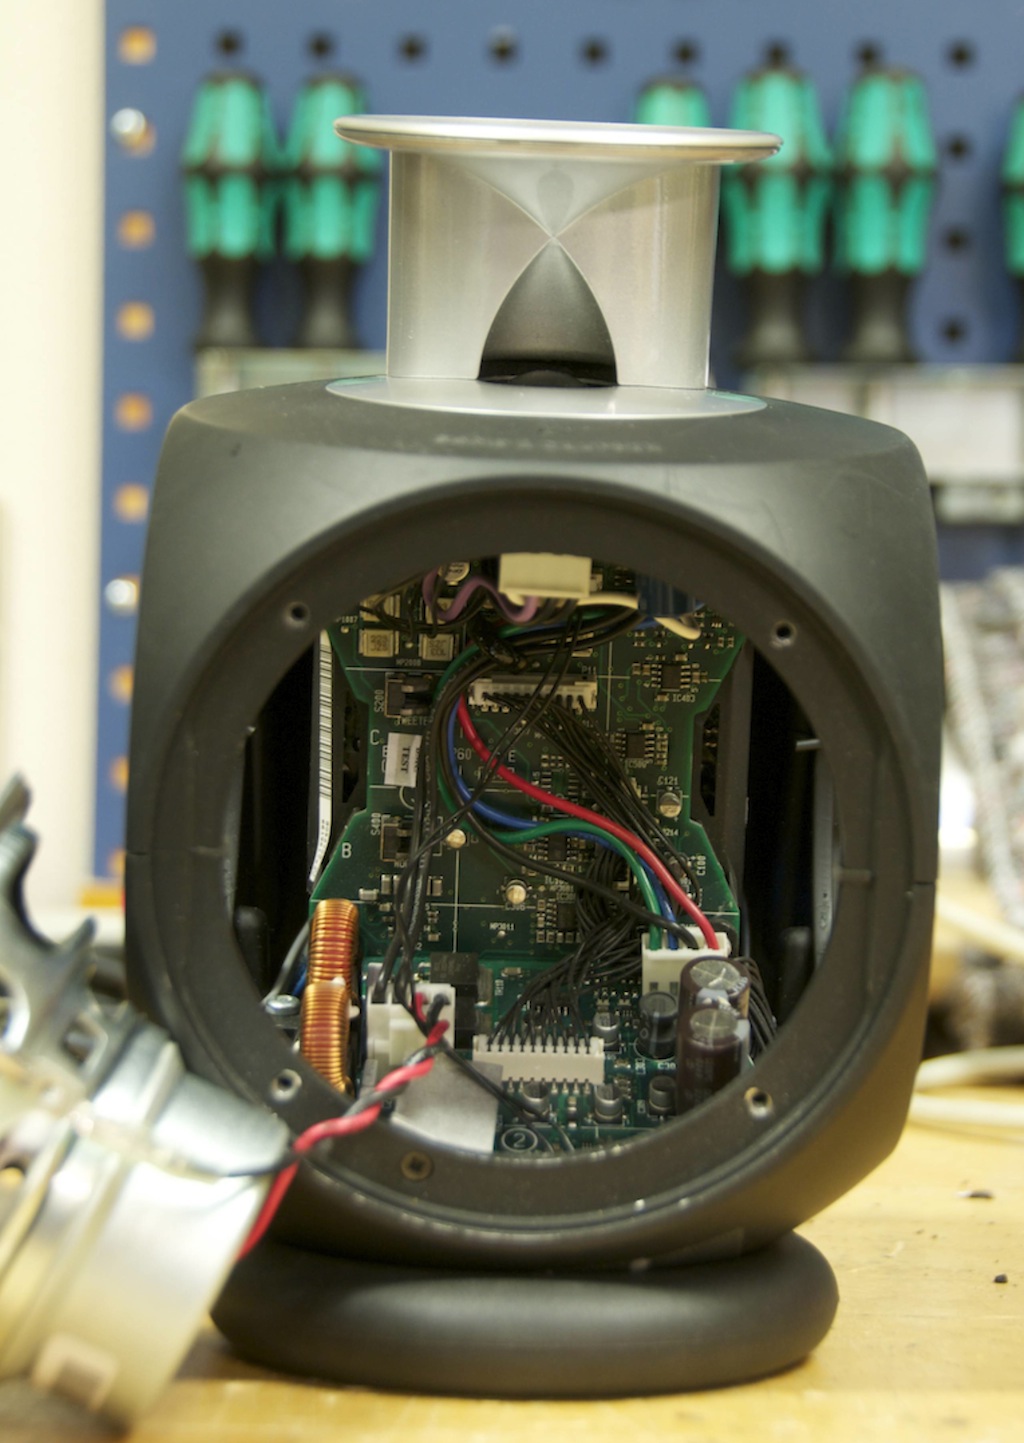
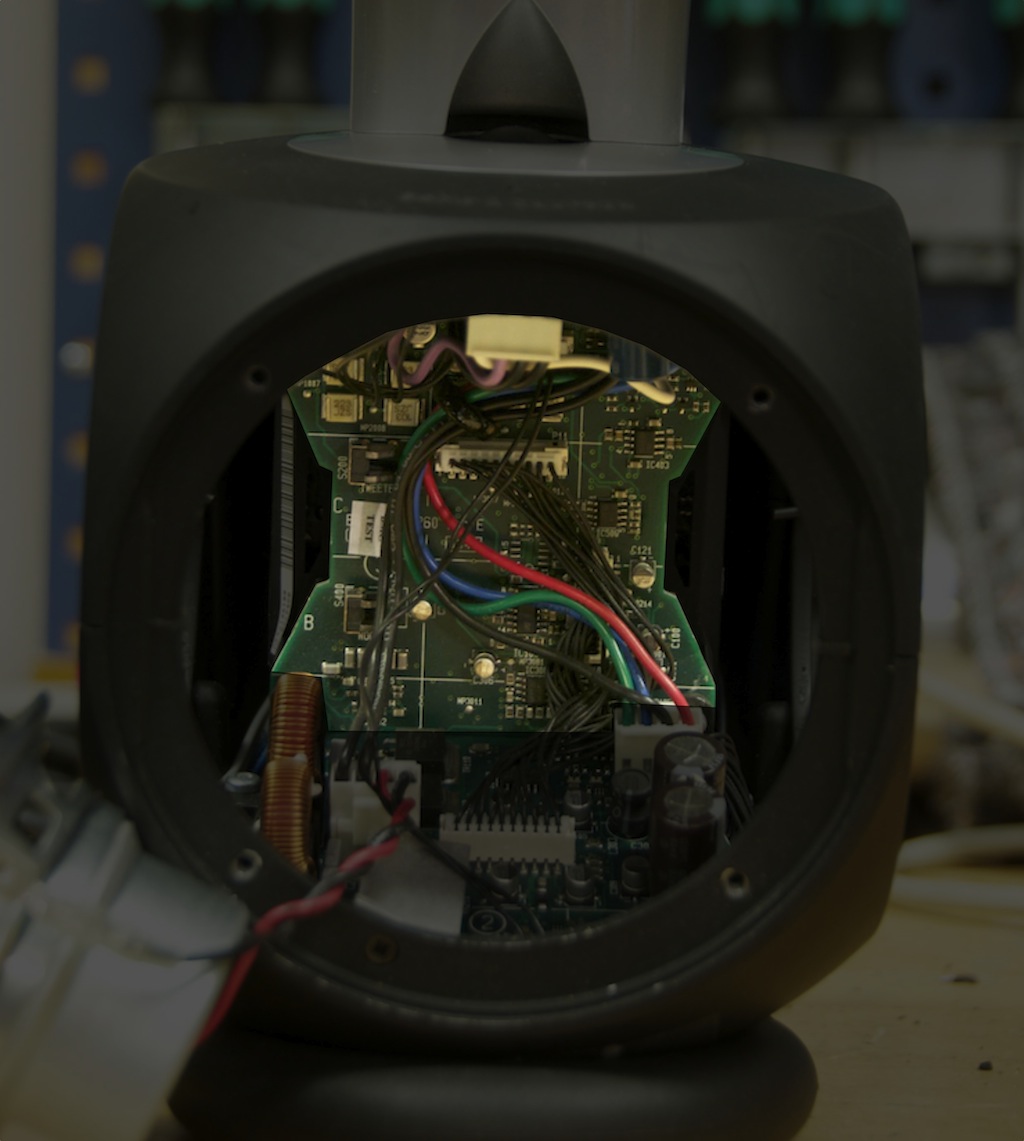
I recently saw a posting on a website showing a “naked” BeoLab 18 – meaning one without the front grille. The enthusiasm generated by that photo made me think that there might be some interest is seeing some Bang & Olufsen loudspeakers when they’re really naked. Visitors to the acoustics department in Struer are greeted by a collection of loudspeakers that have been opened up for viewing. I’ll show some photos of these in future posts. Today, I’ll reveal just two loudspeakers – the BeoLab 3 and the BeoLab 11. Do not try this at home.
 

BeoLab 3

The BeoLab 3 is a two-way fully active loudspeaker with analogue filtering. It has ABL, two 125 W ICEpower Class-D amplifiers driving a 3/4″ tweeter and a 4″ woofer in the front. In addition, it has two side-mounted 4″ passive radiators. If you take the front woofer off, you’ll get a look inside it as is shown below.

BeoLab 3 full frontal.

This gives you a direct view of the printed circuit board (PCB) with the analogue filtering and ABL circuitry which live directly behind and below the woofer.

The filtering and ABL circuitry.

In addition, you can see the PCB with the two power amplifiers on it.

PCB containing the power amplifiers

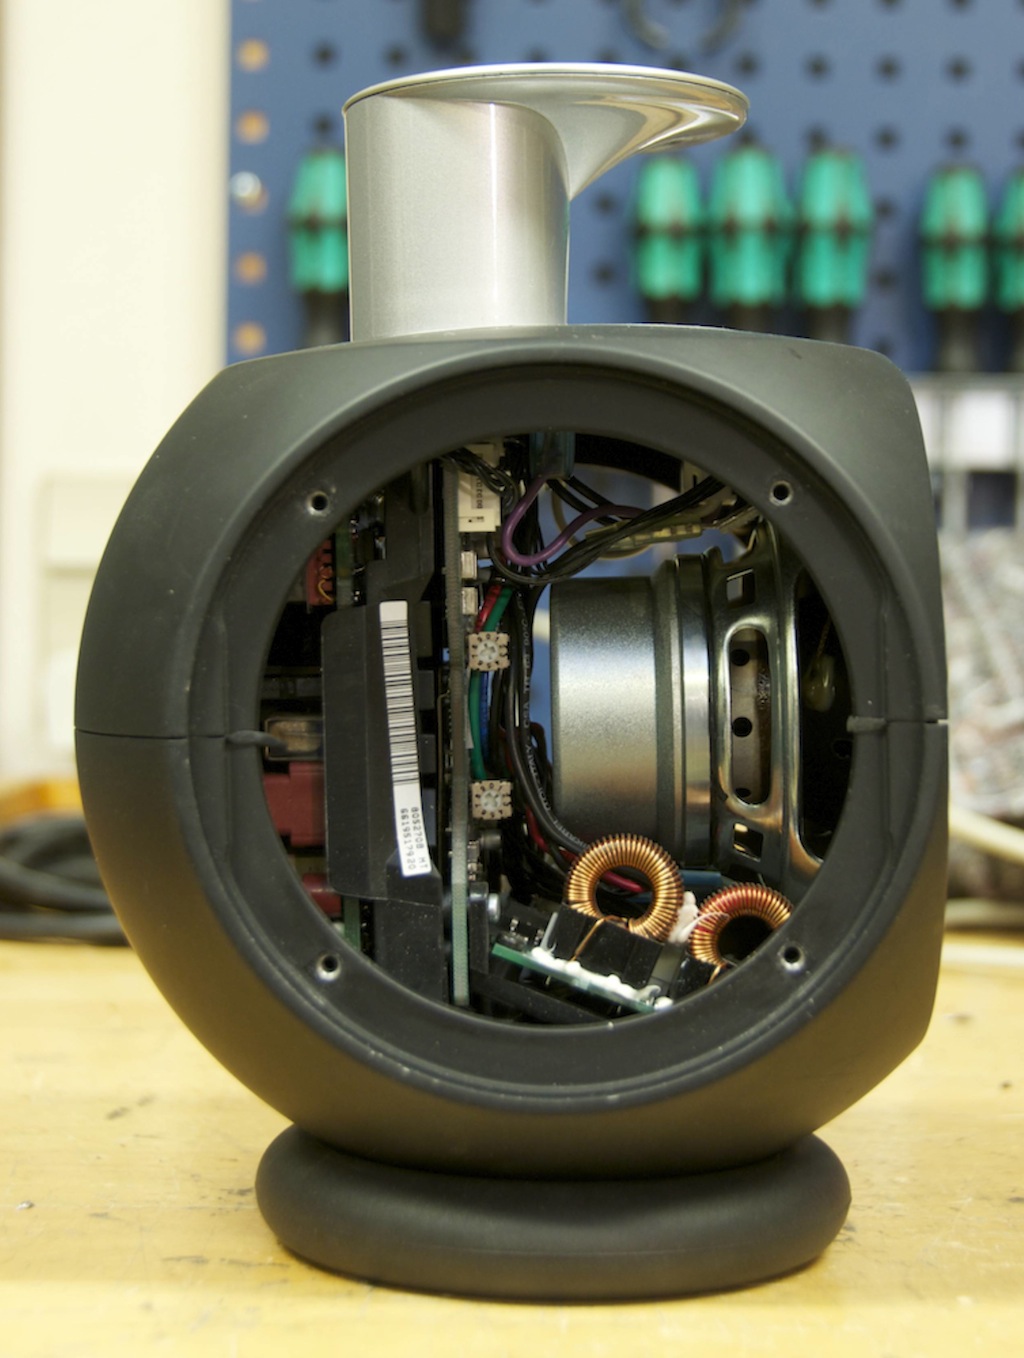
Looking from the sides, through the holes the passive radiators normally occupy, you’ll see how little space there is behind the woofer when it’s mounted in the enclosure.

bl3_right
BeoLab 3 from the side. The two copper coils are part of the amplifier circuitry.

In the photo above, you can see two “potentiometers”, directly behind the woofer, attached to the vertical PCB that contains the filter circuitry (they have numbers printed on them and they look like the heads of phillips screws). These are for making gain adjustments to on the production line (or if you have to get your loudspeaker repaired) to ensure that the woofer and tweeter have the appropriate levels so that they not only match each other, but that they match the “golden sample” that we keep as a Master Reference. These are necessary to adjust for small differences in components within the circuitry as well as the exact sensitivities of the woofer and tweeter.

On the production line, this procedure is actually pretty cool. The acoustic response of the loudspeaker gets measured on the production line, then the two potentiometers are adjusted by hand to ensure that the response of the loudspeaker is correct – then the loudspeaker is measured again to make sure that the adjustment was performed correctly. This is done for each and every BeoLab 3 that we make.

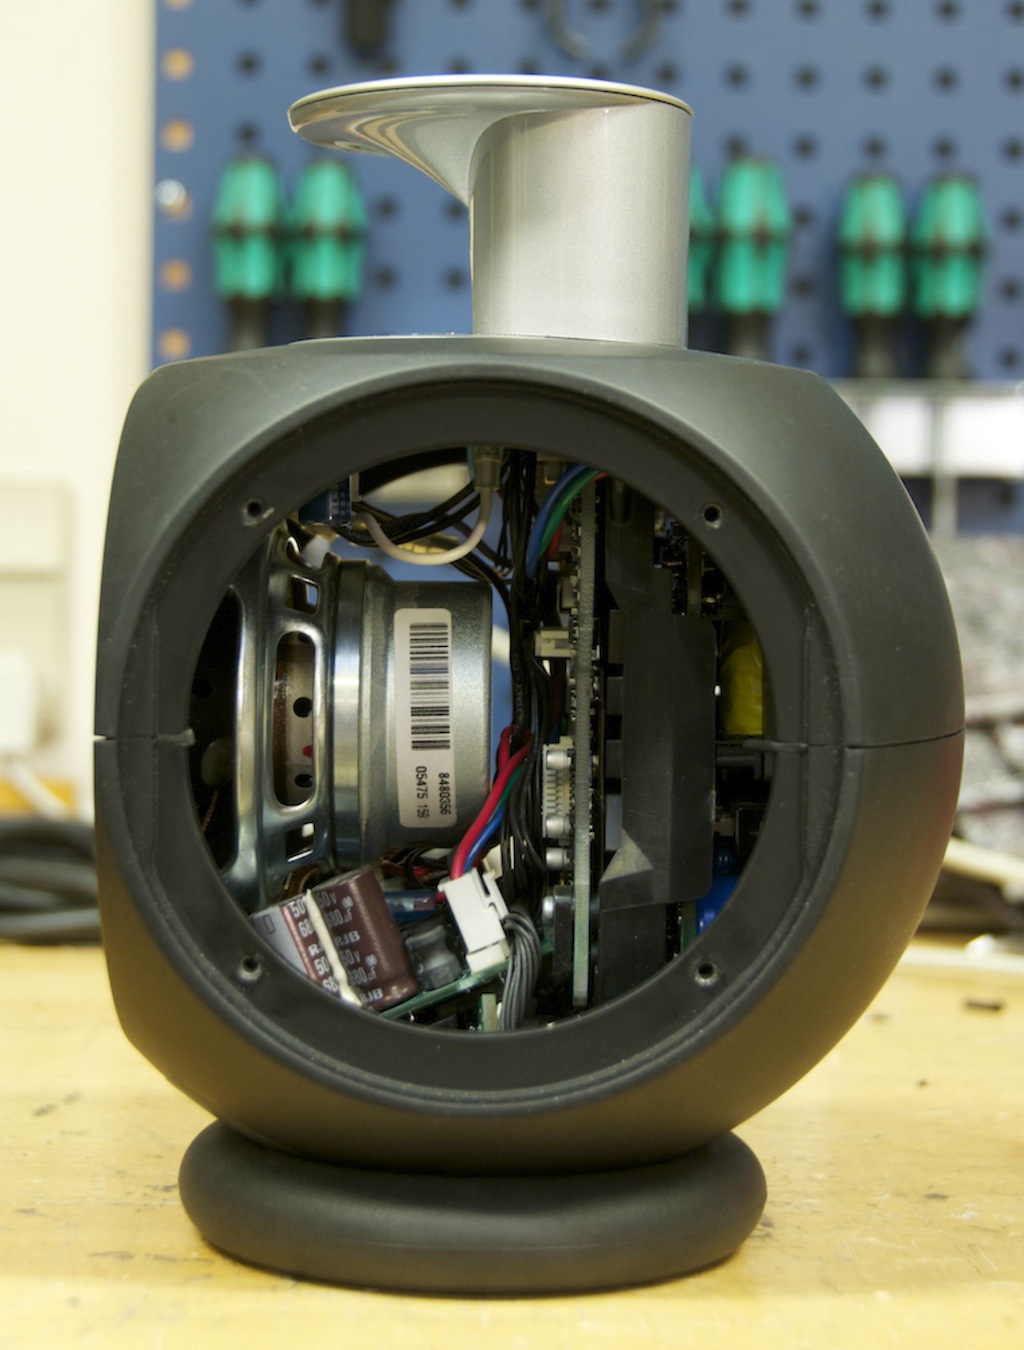
BeoLab 3 from the other side.
BeoLab 3 from the other side. The brown capacitors are part of the amplifier circuitry.

Note that the PCB containing the power supply which delivers the voltage rails and current to the entire loudspeaker is on the “back” of the enclosure, behind the PCB containing the filters and ABL. The photo below shows a highlight of that circuit – although it’s hard to see from the side.

BeoLab 3 power supply board.

I know it’s difficult to see everything in there, so let’s take a different look at the components. The photos below show what could be considered to be an “exploded view” of the BeoLab 3. This was done for a special exhibit, so don’t ask for a similar photo of other loudspeakers in the portfolio. Sorry.

BeoLab 3 exploded view.
BeoLab 3 exploded view. The PCB with the copper coils contains the ICEpower amplifiers. The PCB above it is the filters and ABL circuitry. The PCB in the rear is the power supply for the entire system.
BeoLab 3 exploded view with all the bits labelled.


BeoLab 11

A block diagram of the BeoLab 11 would be surprisingly similar to the BeoLab 3. It has two 200W ICEpower Class-D amplifiers for the two 6.5″ loudspeaker drivers (each in its own sealed enclosure), filtering (although this time, the filter circuit includes a bass management system that also has a high pass filter for a pair of external loudspeakers), ABL, and a power supply.

BeoLab 11 side view.
BeoLab 11 side view. The power supply PCB is above the woofer on the right side in this photo.

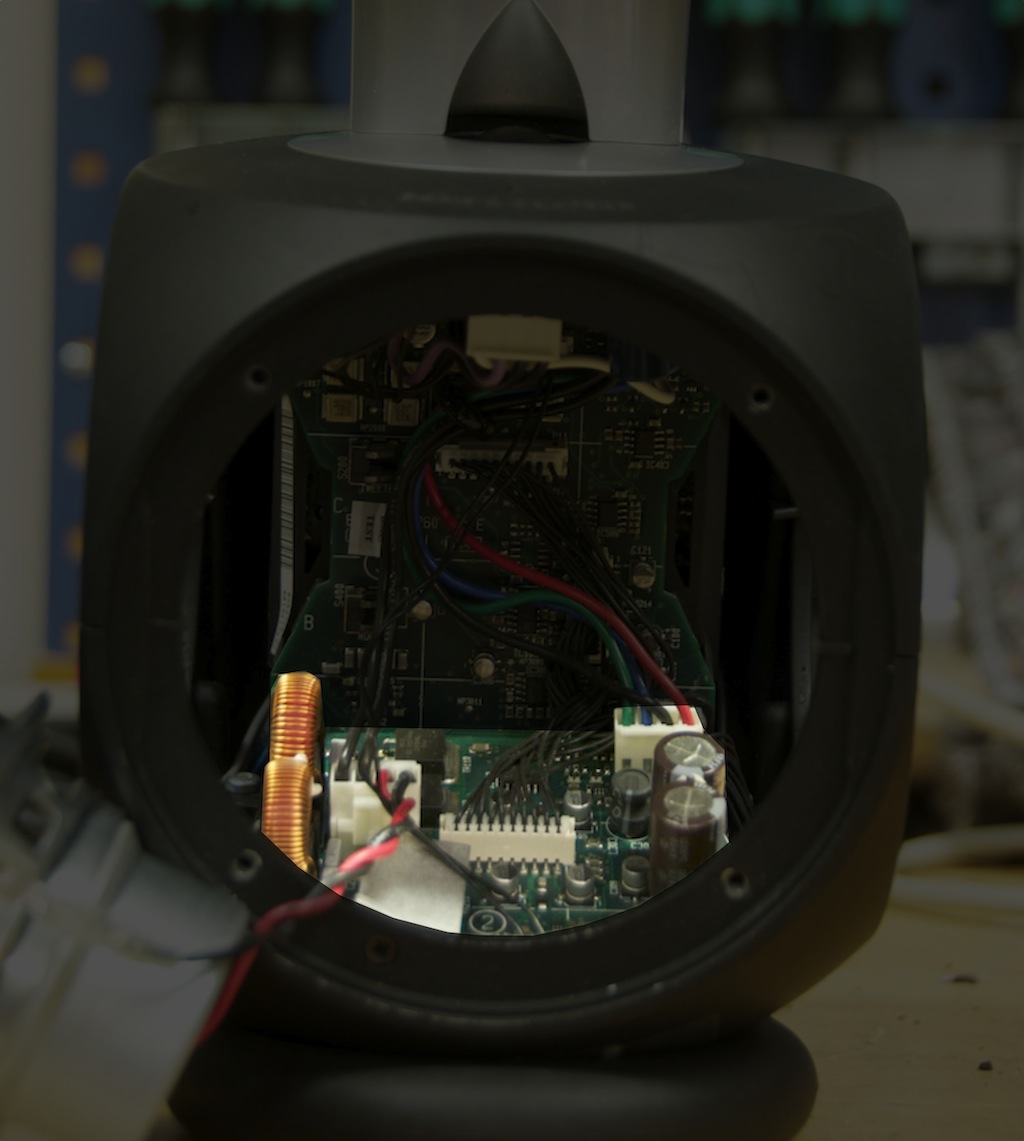
In the posting describing ABL, I mentioned that there are thermal sensors distributed inside B&O loudspeakers to allow the device to continually “know” how hot it is. The photo below shows one of those sensors. It’s mounted on the small, green PCB that is screwed directly to the magnet assembly of the woofer (in the centre of the silver circle). This tells the circuitry the temperature of the woofer magnet. By itself, this information is not really useful, since the woofer magnet can get very hot without suffering damage. What we’re REALLY worried about is the temperature of the wire voice coil that is located inside the magnet – however, we cannot mount a temperature sensor on the coil, since this would stop the loudspeaker from working properly. So, the loudspeaker’s circuitry contains a “thermal model” of the woofer which calculates the temperature of the voice coil based on the temperature of the woofer magnet and the amount of power that has been sent into the woofer. This allows the loudspeaker to calculate the temperature of the voice coil based on the magnet temperature and the music that you’re playing.


BeoLab 11 showing the PCB containing the filter and ABL.
BeoLab 11 showing the PCB containing the filter and ABL. The amplifier module is directly behind the filter PCB, so you can’t see it in this photo.


BeoLab 11.
BeoLab 11 – the other side.


You may notice that there is no thermal sensor on the opposite woofer. This is because the same signal is being sent to both woofers, so it is safe to assume that the two magnets (and therefore the two voice coils) are the same temperature.


BeoLab 11 showing the PCB containing the power supply.
BeoLab 11 showing the PCB’s containing the power supply components (there are two PCB’s here – the big one on the top and the small one on the lower right).


That’s it for this week. Next week, I’ll walk through our development process – describing the steps that we take when we develop a loudspeaker starting with the first meetings with the designer, all the way through to the first products off the production line.


B&O Tech: What’s so great about active loudspeakers?

#2 in a series of articles about the technology behind Bang & Olufsen loudspeakers


Part 1: The very basics

Let’s build a loudspeaker with a relatively decent frequency range. Actually, I should be more specific – I mean not only that it can play a wide range of frequencies, but it can do so adequately loudly to be useful. Chances are that you’ll want it to play down to something around 100 Hz (which is actually not that low… It’s only about an octave and a half below concert C – also known as Middle C to pianists) and up to about 15 000 Hz (which is probably still audible, depending on how old you are, how many hours you have spend clubbing,  how loudly your iThingy is usually playing, and whether or not you use ear plugs when you ought to…).

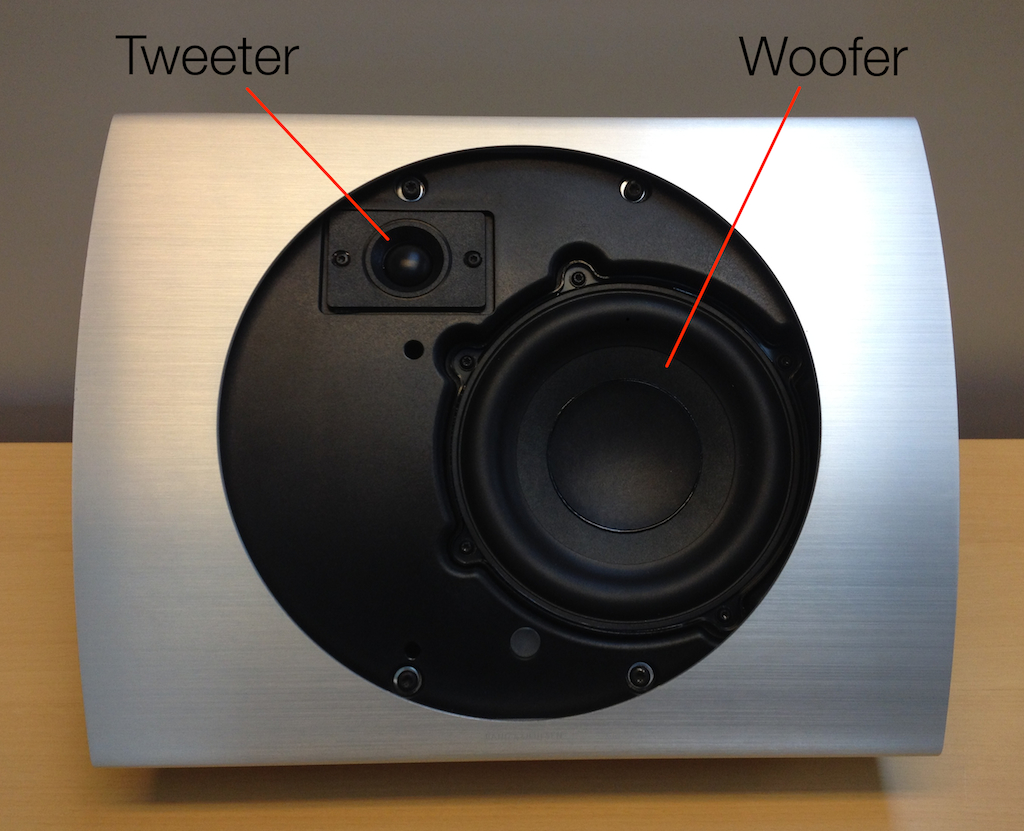
In order to do this, you’ll probably have to use at least two loudspeaker drivers – a woofer for the low frequencies (say, below about 2000 – 3000 Hz) and a tweeter for the high frequencies. The woofer is either big in diameter (say, about 12 to 40 cm) , or it can move very far in and out, or both. The tweeter is much smaller in diameter (on the order of 20 mm or so in diameter), and doesn’t need to move in and out as much. For the purposes of this posting, let’s say that that’s enough (which is not entirely infeasible – there are many loudspeakers in the world that are based on one woofer and one tweeter. Some of them are actually good!) The reason you need a bigger loudspeaker driver for the low frequencies is because, the lower you go in frequency, the more air molecules you need to move. Unfortunately, for every time the frequency is halved (i.e. you go down one octave), you need to quadruple the volume of air that you have to move in order to get the same sound pressure level. So, when it comes to bass, physics is your enemy.

bl17_naked
A woofer and a tweeter in an enclosure.

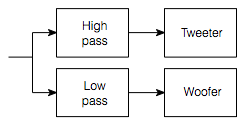
Okay, so we have a woofer and a tweeter, and each of them has to get a different portion of the audio signal. This means that we have to divide the signal using something called a “filter” which, in its most basic form, lets some frequencies through unimpeded and makes other frequencies quieter. A “high pass filter” will let high frequencies through and make lower frequencies quieter. A “low pass filter” will do the opposite. So, we put a low pass filter in the path of the signal going to the woofer, and a high pass filter in the path of the signal going to the tweeter. The combination of those two filters are what is called the crossover, since it is the circuit that allows the audio signal to cross over from the woofer to the tweeter and back again, as is necessary.

speaker_01
A basic crossover block diagram.
penta_crossover
A rather typical crossover from an old loudspeaker. The photo shows both the low pass and the high pass filter boards.

 Part 2: Amplification

Unfortunately, loudspeaker drivers are very inefficient. Typically, you should expect about 1% of the electrical power you send into a loudspeaker driver to be available as acoustical power. The other 99% is lost as heat. This means that if you want your loudspeakers to play loudly, then you’re going to have to feed them with a lot of power (because you are throwing away 99% of what you put in). Consequently, you need something called a “power amplifier” connected to the loudspeaker drivers. This is a device that has a small audio signal coming into it (typically a change in voltage with almost no current) – it makes the signal much louder, typically by increasing the voltage by some multiplication factor (say, around 20 times) and making current available as is needed. (And since voltage multiplied by current is power, we get a power amplifier.)


Part 3: Signal flow

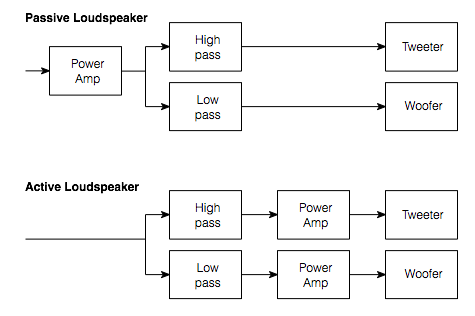
Now we start getting into the interesting stuff. At this point in the process of designing our loudspeaker, we have to make a choice. Either

  • we put one power amplifier at the start of the chain, and filter its output before sending the signals on to the woofer and tweeter (a passive loudspeaker design), or
  • we filter the signals first and then use a separate power amplifier for each driver (an active loudspeaker design) .
active_vs_passive
The simplified block diagrams of a typical passive loudspeaker crossover and an active loudspeaker crossover.

To be honest, if the diagram above was all there was to it, there wouldn’t really be much point in making an active loudspeaker. If all we did was to make relatively simple low pass and high pass filters, we basically could do the same filtering to the audio signal either way. The passive filtering circuit is big, and the active filtering circuit is small (basically because the passive components have to be able to dissipate more power) but the power amps in the active design take up space, so there’s not much gained there. So what’s the point?  Some people will make the claim that the amplifier has “better control” of the loudspeaker driver if there is no circuitry (like a low-pass or a high-pass filter) between them. However, to be honest, even if that were true enough to make an audible difference in things (I won’t say whether it is or it isn’t – since this is a debate best left out of this posting), it certainly wouldn’t be the first item on your list-of-things-to-worry-about. So, what IS the point?

Light Column, Top to bottom: (1) A power resistor (2) a resistor (3) an SMD resistor. Middle column has two capacitors on top and an SMC capacitor below. The Right side is an inductor.
Left Column, Top to bottom: (1) A power resistor (2) a good-op’-fashioned axial-lead resistor (3) an SMD resistor (the dot above the 2.7 cm mark on the ruler). The middle column has two capacitors on top and an SMC capacitor below (the other dot above the 7 cm mark on the ruler). The right side is an inductor. As you can see, the SMD components (which are what we use these days…) are much smaller than everything else on the photo.

Well, in order to get the point, we need to know a little more about how a driver behaves when you put it in an enclosure.

Part 4: Some basic acoustics

Take a really big sealed box and cut a hole in one side that has the same diameter as a woofer. Put the woofer in the hole so that the woofer is now in a “sealed enclosure”. If you do a frequency response measurement of the output of the woofer (on-axis, meaning “directly in front of the woofer” you’ll probably see that, as you go lower and lower in frequency, you’ll reach a point where the output of the woofer drops as you go lower. In fact, it has a natural high-pass characteristic. The reasons for this are beyond the scope of this discussion – you’ll either have to trust me on this one, or go read more stuff. If you thump the woofer with your thumb when it’s in this box, it will sound a little like a kick drum – it’ll go “thump”.

If you make the box much, much smaller in volume, you’ll see that the natural frequency response of the system changes. This is because the air in the box acts as a spring behind the woofer, and as the box gets smaller, the spring gets stiffer. The result of this in the frequency response is that you get a peak at some frequency. If you thump the woofer in this smaller box, you’ll now hear it ringing (at the frequency where you see that peak in the response) – now it goes ‘boommmmmm’, humming at one pitch – a bit like a big bell. The smaller you make the box, the higher in frequency the pitch go, and the longer it will ring. In addition, you’ll notice that there is a lot less low-frequency output below the ringing frequency.

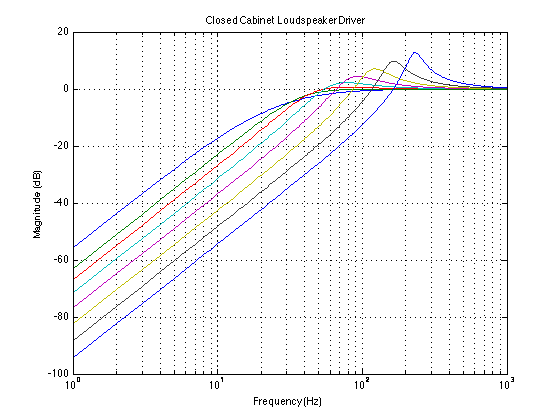
If you take a look at the plot below, you can see examples of this. The curves show the response of the same woofer in different sized sealed enclosures. The flattest curve is the biggest box – notice that it doesn’t have a peak poking up, and it has about 40 dB (this is a LOT) more output at the very bottom end (okay, okay, it’s 1 Hz, but the absolute values aren’t important here – it’s the difference in the curves that counts). The curve with the biggest peak is the result of putting a woofer in a box that’s just too small for it. (If you’d like to know the details behind this plot, read this.)

Magnitude responses of a loudspeaker driver in a sealed cabinet. Each curve is a different cabinet volume.


Part 5:  Bringing it all together

Let’s start this section by admitting a simple fact: if the only thing criterion you use to judge a loudspeaker with is the volume of the enclosure behind the loudspeaker drivers, Bang & Olufsen loudspeakers are too small (yes – even the BeoLab 5). Take any of our loudspeakers, and you have an example of a woofer that is put in an enclosure that has too little volume for it to behave well naturally. In other words, when we look at the natural response of any of our loudspeakers, they look more like the “bad” curve than the “good” curve in the plots above. This means that we have to encourage  it to behave a little better. This means, in the simplest case (still looking at the curves above) that we have to boost the bass and remove the peak in the natural response of the system.


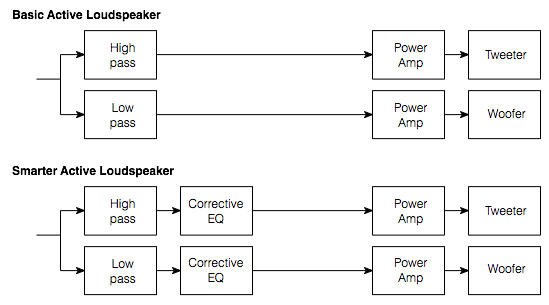
A slightly smarter active equalisation with extra filters for compensation and sound design.


We do this by making a filter (in addition to the low pass filter) that overcomes the natural behaviour of the woofer in its enclosure. If we want more bass out of the system, we turn up the bass. If we want to remove a 7.3 dB peak at 143.5 Hz that has a Q of 4.6, then we put in a dip of 7.3 dB at 143.5 Hz and a Q of 4.6 (If those terms don’t make any sense, don’t worry – all that’s really important to know is that we can “undo” the effects of a peak in the natural response of the system by putting in a reciprocal dip in the signal that we feed it.)

In theory, this is possible using filters that happen after the amplifier – but it is certainly MUCH MUCH easier to make those filters (even without going to digital processing) using small resistors and capacitors and op amps before you get to the amplifiers. For example, you can see in the photo above, the SMD resistor and capacitor (which can be used in a modern active crossover) are much smaller than the power resistor and the inductor (which we would still have to use in a passive crossover).

So, even if you’re not doing anything other than trying to customise the sound of a loudspeaker using some filters (also known as equalisers) – as we do in almost all of our loudspeakers – it is smarter to make an active loudspeaker than a passive one.


An active crossover with extra equalisation filters from an older B&O two-way loudspeaker.

Part 6: The beneficial side effects

So, in order to compensate for the acoustical effects of putting a woofer in too small a package, we have to make an active loudspeaker design instead of a passive one.

But this then raises the question, now that we have an active loudspeaker, what else can we do? The answer is lots of stuff!

Since we can apply filtering independently to each loudspeaker driver we can do some serious customisation of the system. To give just a few simple examples:

  • You have a resonance in the woofer at a frequency that is above the crossover. You want to correct the problem in your filtering (because you can hear and/or measure it), but the problem does not exist in the midrange. So, you want to have a filter on the woofer alone – not the woofer and midrange and a passive crossover.
  • You want to do some dynamic processing on a driver without affecting the others. (for example, ABL)
  • You want to compensate for small differences in loudspeaker driver sensitivity on a production line by doing an automated measurement and a gain offset on a driver-by-driver, loudspeaker-by-loudspeaker basis to ensure that loudspeakers leaving the factory are better matched to the “golden sample”


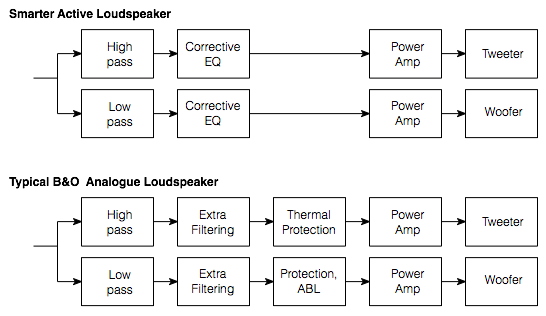
A simplified typical block diagram of an analogue Bang & Olufsen loudspeaker.
A simplified typical block diagram of a two-way active Bang & Olufsen loudspeaker (note that it says “Typical B&O Analogue Loudspeaker” – this is a mis-typing on my part. It should read “Typical B&O Active Loudspeaker”). Note that “Corrective EQ” has changed to “Extra Filtering” since it includes the sound design and not just compensation for acoustic behaviour due to, for example, enclosure size.


An active loudspeaker design makes all of these examples MUCH easier (or perhaps even “possible”) to achieve.

Conclusion 

All of that being said,

  • if your electroacoustical behaviour of every component in your audio chain was “perfect” (whatever that means) AND
  • if loudspeakers behaved linearly (i.e. they gave you the same frequency response at all listening levels, and they didn’t change their behaviours when they heat up, and so on and so on) AND
  • if you did everything properly (meaning that your cabinets were the right size and shape) AND
  • if your production tolerances of every component in the system was +/- 0%.

Then MAYBE a passive loudspeaker design could work just as well as an active design…

B&O Tech: What is “ABL”?

Header info #1 for full disclosure: I’ve been given the green light from the communications department at Bang & Olufsen to write some articles describing some of the more technical aspects of B&O loudspeakers here on my own blog site. This is the first posting in what will be a series of articles.

Header info #2 for fuller disclosure: This particular posting will look familiar to some forum people at www.beoworld.org, since I wrote the original version of this as a response to one of the questions on their site. However, I’ve beefed up the response a little – so if you’ve come here from beoworld, there is only a little new information in here.

Almost all loudspeakers made by Bang & Olufsen include Adaptive Bass Linearisation or ABL. This includes not only our “stand alone” loudspeakers (the BeoLab series) but also our iPod docks and our televisions. The only exceptions at the moment are our passive loudspeakers, headphones, and the BeoLab 5.

There is no one technical definition for ABL, since it is in continual evolution – in fact it (almost) changes from product to product, as we learn more and as different products require different algorithms. Speaking very broadly, however, we could say that it reduces the low frequency content sent to the loudspeaker driver(s) (i.e. the woofer) when the loudspeaker is asked to play loudly – but even this is partially inaccurate.

It is important to note that it is not the case that this replaces a “loudness function” which may (or may not) be equalising for Equal Loudness Contours (sometimes called “Fletcher-Munson Curves”). However, since (generally) the bass is pulled back when things get loud, it is easy to assume this to be true.

When we are doing the sound design for a loudspeaker (which is based both on measurements and listening), we make sure that we are operating at a listening level that is well within the linear behaviour of the loudspeaker and its components. (To be more precise, when I’m doing the sound design, I typically use a standard-ish playback level where -20 dB FS full-band pink noise results in something like 70 dB (C) at the listening position (sometimes I use 75 dB (A) – but, depending on the amount of low end in the loudspeaker, this might result in the same volume setting).)

This means that

  • the drivers (i.e. the woofer and tweeter) aren’t being asked to move too far (in and out)
  • the amplifier is nowhere near clipping
  • the power supply is well within its limits, and
  • nothing (not the power supply, the amplifiers, or the voice coils) is getting so hot that the loudspeaker’s behaviour is altered.

This is what is meant by “linear” – it’s fancy word for “predictable”, (Not to mention the fact that if we were listening to loudspeakers at high levels all the time, we would get increasingly bad at our jobs due to hearing loss.)

So, we do the tuning at that low-ish listening level where we know things are behaving – remember that we always do it at the same calibrated level every time for every loudspeaker so that we don’t change sound design balance due to shifts associated with equal loudness contours. (If you tune a loudspeaker when it’s playing loudly, you’ll wind up with a loudspeaker with less bass than if you tuned it quietly. This is because you’re automatically compensating for differences in your own hearing at different listening levels.)

Once that tuning is done, then we go back to the measurements to see where things will fall apart. For example, in order to compensate for the relatively small cabinet behind the woofer(s) in the BeoSound 8 / BeoPlay A8, we increase the amount of bass that we send to the amplifiers for the woofers as part of the sound design. If we just left that bass boost in when you turn up the volume, the poor speaker would go up in smoke – or at least sound very bad. This could be because

  • the woofer is being pushed/pulled beyond its limits, or
  • because the amplifier clips or
  • the power supply runs out of steam or
  • something else.

(Note that BeoSound 8’s do not actually run on steam – but they do contain the magic smoke that keeps all audio gear functioning properly.) So, we put the loudspeaker in a small torture chamber (it’s about the size of a medium-sized clothes closet), put on some dance music (or some slightly more-boring modified pink noise) and turn up the volume… While that’s playing, we’re continually monitoring the signal that we’re sending to the loudspeaker, the driver excursion, the demands on the electronics (i.e. the amp’s, DAC’s, power supply, etc) and the temperature of various components in the loudspeaker, along with a bunch of other parameters…

beosound_8_last_prototype
One of the last BeoSound 8 prototypes. The orange/black wires connect directly to the woofers. The purple/white wires connect directly to the tweeters (at this stage of development, we are still using external amplifiers). Most of the other wires go into thermal sensors inside the device to see how hot things are getting inside. Some of these thermal sensors are actually in the final product that the customer buys. Some are just for development purposes and are not in the final product.

Armed with that information, we are able to “know” how those parameters behave with respect to the characteristics of the music that is being played (i.e. how loud it is, in various frequency bands, for how long, in both the short term and the long term). This means that, when you play music on the loudspeaker, it “knows”

  • how hot it is at various locations inside,
  • the loudspeaker drivers’ excursions,
  • amplifier demands,
  • power supply demands,
  • and so on. (The actual list varies according to product – these are just some typical examples…)

So, when something gets close to a maximum (i.e. the amplifier starts to get too hot, or the woofer is nearing maximum allowable excursion) then SOMETHING will be pulled back.

WHAT is pulled back? It depends on the product and the conditions at the time you’re playing the music. It could be a band of frequencies in the bass region, it could be the level of the woofer. In a worst-case-last-ditch situation, the loudspeaker might even be required to shut itself down to protect itself from you. Of course, there is no guarantee that you cannot destroy the loudspeaker somehow – but we do our best to build in enough protection to cover as many conditions as we can.

HOW is it pulled back (i.e. how quickly and by how much)? That also depends on the product and some decisions we made during the sound design process, as well as what kind of state-of-emergency your loudspeaker is in (some people are very mean to loudspeakers…).

Note that all this is done based on the signals that the loudspeaker is being asked to produce. So it doesn’t know whether you’ve turned up the bass or the volume – it just knows you’re asking it to play this signal right now and what the implications of that demand are on the current conditions (voice coil temperature, for example) This is similar to the fact that the seat belts in my car don’t know why the car is stopping quickly – maybe it’s because I hit the brakes, maybe it’s because I hit a concrete wall – the seat belts just lock up when they’re asked to move too quickly. Your woofer’s voice coil doesn’t know the difference between Eminem and Stravinsky with a bass boost – it just knows it’s hot and it doesn’t want to get hotter.

It’s important to note that some of what I’ve said here is not true for some products. Bang & Olufsen’s analogue loudspeakers cannot have the same amount of “self-knowledge” as the digital loudspeakers because they don’t have the same “processing power”.  However, we make every effort to ensure that you get as much as is possible out of your loudspeaker while still ensuring that you can’t do any permanent damage to it. However, it’s fair to say that, the more recent the model, the closer we are able to get to the maximum limits of the total system for a longer listening period.

Bang & Olufsen BeoLab 14 reviews

b-o_beolab_14_0


recordere.dk’s review

“Beolab 14 er et harmonisk sæt, der lyder godt som en samlet enhed. Netop det at det spiller som én samlet enhed, hvor der er kælet for detaljerne, er med til at løfte det flere niveauer op. Bassen virker stram og velafballanceret, men med rigeligt power til effektscenerne i actionfilmene. Mellemtonen virker klar og naturlig, og selv vokaler i highend audio (24-bit) gengives sprødt og realistisk. Diskanten runder det hele fint af i toppen.”


hifi4all.dk’s review

“Beolab 14 sættet lyder ganske enkelt rigtig godt. Der er den rette mængde bas (hvilket man jo egentlig selv bestemmer), et mellemtoneområde, som bare er der uden at gøre væsen af sig, og en diskant som har den rette afrunding mod toppen, hvilket giver god mening sammen med 2,5” enhederne, som per design ikke er konstrueret til ultra høje frekvenser. Og så hænger det hele rigtig godt sammen! Altså det man kalder en homogen gengivelse af musikken.”


Why does a subwoofer need so many knobs?

So, you just bought a subwoofer and it has a bunch of controls on it with some familiar names like “level” or “gain”, some sort-of-familiar ones like “cutoff frequency” and “phase” (or, more correctly “polarity” or maybe a switch that says “invert”), and possibly a really unfamiliar knob that says “phase” or “all pass” that goes from a low number to a high number (maybe).

What do all of these controls do, and how do you adjust them?

Well, let’s start with a simple system. We have one subwoofer, one main loudspeaker (let’s say, the left front one) and a “crossover” that divides the energy in the frequency bands appropriately and correctly (in other words, it splits up the bass and the mid/treble and sends the lower stuff to the sub and the upper stuff to the main loudspeaker). Let’s also start with a situation where the subwoofer and the main loudspeaker are the same distance from you, the listener. They’re both set to the correct gain. Everything else in the system is perfect, and you are outdoors (that way, there are no nasty room acoustics to screw us up).

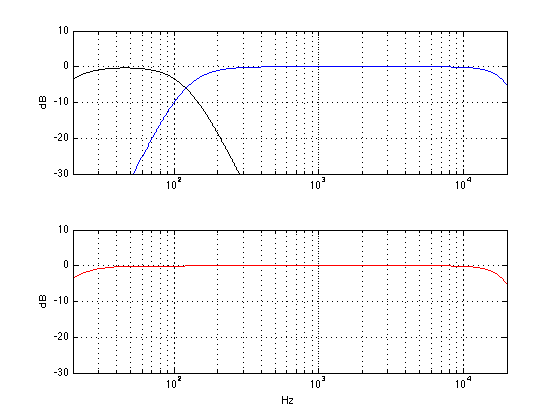
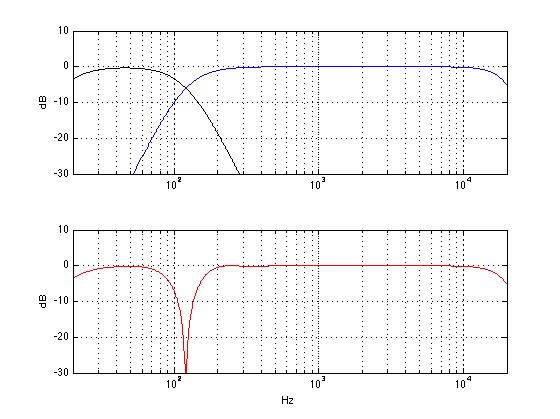
The result of all of this, at the listening position, will be something like the figure below. The black curve shows the output of the subwoofer. (I’ve limited its output to 120 Hz – a typical value – but as you can see, it has lots of output above 120 Hz – it just gets lower and lower in level as you go higher and higher in frequency.) The blue curve shows the output of the main loudspeaker, with a lower limit of 120 Hz. The red curve shows the result of the two of the curves being added together. Note that I have not just added the black and the blue curves. I have actually added the two outputs plotted the result as a frequency response.

The output of a subwoofer and a main loudspeaker, with a "correct" crossover, at the same distance, with the same gain, with no room acoustics to bother anyone...
The output of a subwoofer and a main loudspeaker, with a “correct” crossover, at the same distance, with the same gain, with no room acoustics to bother anyone…

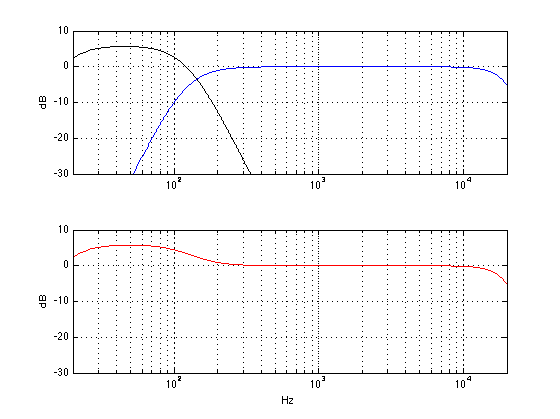
Now, let’s change one little thing. We’ll leave everything untouched except for the GAIN (or LEVEL or VOLUME) knob on the subwoofer. Let’s start by turning that up by 6 dB. This means that you now have twice as much sound pressure from the subwoofer. The result will not come a a surprise. As you can see in the red graph below, you get more bass. In fact, you get 6 dB more bass. So, if you like more bass (and you don’t have neighbours), then this is a good idea.


The output of a subwoofer and a main loudspeaker. The subwoofer's gain has been increased by 6 dB. The distance to both loudspeakers is the same.
The output of a subwoofer and a main loudspeaker. The subwoofer’s gain has been increased by 6 dB. The distance to both loudspeakers is the same.


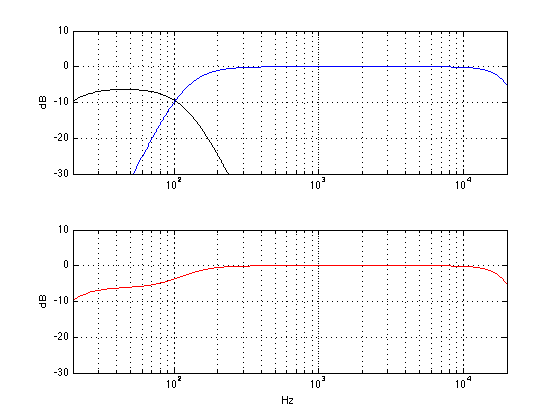
Similarly, we can leave everything untouched except for the GAIN (or LEVEL or VOLUME) knob on the subwoofer and turning it down by 6 dB. This means that you now have half as much sound pressure from the subwoofer. As you can see in the red graph below, you get less bass. In fact, you get 6 dB less bass. So, if you don’t like more bass (or if you have cranky neighbours or sleeping children), then this is a good idea instead.


The output of a subwoofer and a main loudspeaker. The subwoofer's gain has been decreased by 6 dB. The distance to both loudspeakers is the same.
The output of a subwoofer and a main loudspeaker. The subwoofer’s gain has been decreased by 6 dB. The distance to both loudspeakers is the same.


Okay, enough of the easy stuff. Let’s get complicated. Let’s set the gain of the subwoofer back to “correct” and move the subwoofer away a little bit. We’ll start by moving it 1.433 m (that’s about 4′ 8 1/2″ for those of you in the USA…) further away from the listening position than the main loudspeaker (I have chosen this value carefully, but it doesn’t matter how, for the purposes of this discussion…) Now, without fiddling with any of the knobs, what do we get at the listening position? Well, that will look like the figure below.


The output of a subwoofer and a main loudspeaker, with a "correct" crossover, with the same gain, with no room acoustics to bother anyone... The subwoofer is 1.433 m further away than the main loudspeaker.
The output of a subwoofer and a main loudspeaker, with a “correct” crossover, with the same gain, with no room acoustics to bother anyone… The subwoofer is 1.433 m further away than the main loudspeaker.


There are two important things to notice in the plot above. The first thing is that the black and blue curves are identical to the ones in the plot at the top. This means that the individual outputs of the subwoofer and the main loudspeaker have the same frequency content as they did when we started. This should not come as a surprise, since all we did was to move the subwoofer – it should have the same output. The second thing to note is that there is now a big dip in the red curve at 120 Hz. Why is this? Well, it’s because when the two loudspeakers have a difference in distance of 1.433 m, they don’t line up in time. The practical result of this is that, at 120 Hz, both of the loudspeakers “push” air at the same time, and that high pressure in the air starts moving towards you. A little while later, both loudspeakers (which is closer to you) are “pulling” air, making a low pressure in the air. The problem is that, due to the speed of sound being “only” 344 m/s, the amount of time it takes the high pressure to get from the subwoofer to the main loudspeaker (1.433 m away…) is exactly the same amount of time it takes for both speakers to change from “pushing” to “pulling”. So, when the high pressure from the subwoofer passes by the main loudspeaker, the main loudspeaker is creating an equal (but opposite) low pressure. Those two pressures (one high and one low) add together in the air and cancel each other out. As a result, you can think that the output of the main loudspeaker counteracts the output of the subwoofer, and you get less.

The important thing to remember here is that both speakers are working just as hard as they did before – it’s just that you don’t get any output at that one frequency. Note as well that the frequency where the subwoofer and the main loudspeaker cancel each other is dependent on how far apart they are, as we’ll see later.

What does this sound like? Well, you might notice that there are a couple of bass notes (specifically, around the B a little more than an octave below middle C) are much quieter than the other bass notes. Or, you might just experience that you have less bass generally. For those of you who think that “bass” is much lower than 120 Hz, you might experience that the total system loses warmth in the sound (although “warmth” is generally a little above 120 Hz… depending on your tastes…)

So, how do we fix this problem? Well, since we have a problem with high pressures getting cancelled by low pressures, one solution is to “flip” the output of the subwoofer so that it generates a low instead of a high and vice versa. (In other words, we’re telling it to “push” out instead of “pulling” in and vice versa. We can do that by changing the POLARITY or PHASE  or Ø switch (those are just different names for the same thing – sort of…) on the subwoofer to NEGATIVE or INVERT. The result of this, at the listening position, is shown below.


The subwoofer is 1.433 m further away than the main loudspeaker. The polarity (or "phase") of the subwoofer is inverted (or "out of phase".
The subwoofer is 1.433 m further away than the main loudspeaker. The polarity (or “phase”) of the subwoofer is inverted (or “out of phase”.


As you can see in that plot above, the result isn’t perfect, but it’s a lot better. The deep notch that we had at 120 Hz is gone, and now all we have is a little ripple around the “crossover region” where the outputs of the two loudspeakers overlap.

There are some people who think that there is an audible difference between the sound of a kick drum “pushing” a loudspeaker out (and making a high pressure) and “pulling” a loudspeaker in (and making a low pressure) and, as a result, they don’t like flipping (or inverting) the polarity of a subwoofer. If you’re that kind of person, and if you have a PHASE or ALLPASS knob on your subwoofer, you have an option. An allpass filter is a special filter that does not change the magnitude (or output level) of the signal, but it does change the phase as a function of frequency. What that means (sort of) is that it can add (or subtract) different delays for different frequencies (I know, I know, it’s not a delay – but if you can think of a better way to describe it to neophytes, be my guest). If we use an all pass filter (for the geeks, I’m using a second-order allpass filter) and set its frequency to 120 Hz and apply that to the subwoofer signal, the result is shown in the plot below.

In other words, if you have a problem like this, and you flip the polarity switch and get those missing bass notes back (or the bass in general – or the warmth), then you’ve probably fixed the problem.


The subwoofer is 1.433 m further away than the main loudspeaker. The polarity (or "phase") of the subwoofer is normal. The allpass filter has been set to a frequency of 120 Hz.
The subwoofer is 1.433 m further away than the main loudspeaker. The polarity (or “phase”) of the subwoofer is normal. The allpass filter on the subwoofer has been set to a frequency of 120 Hz.


As you can see in that plot above, the result still isn’t perfect. In fact, it’s a little worse than the polarity invert solution – but it’s still a lot better than the problem we’re solving. The deep notch that we had at 120 Hz is gone, and now all we have is a little (but slightly bigger) ripple around the “crossover region” where the outputs of the two loudspeakers overlap.

The reason this particular setting of the allpass filter worked is because I had a 2nd order allpass filter, and I set it to 120 Hz. This meant that the phase “delay” of the allpass filter was the same as the phase “delay” caused by the difference in distance. If I had used an allpass filter with a different order (i.e. a 1st order), and/or a different frequency, and/or a different distance, this would not have worked as well (we’ll see that as an example below…).

So, the moral of the story here is that, if you have the problem caused by distance, and you play with the ALLPASS or PHASE knob, and listen to those missing bass notes, just fiddle with the knob until the bass notes are there…


But what happens if the subwoofer is further away than the main loudspeaker but not as far away as we have been looking at above? Let’s place the subwoofer 0.72 m (2′ 4 1/4″) further away than the main loudspeaker and take a look at the result – shown in the red plot below.


The subwoofer is 0.72 m further away than the main loudspeaker.


Now you can see that we still have a dip at 120 Hz, but it’s not as bad as when the subwoofer was 1.4 m away. This is because the time alignment of the two loudspeakers is better, the closer together they are.

So, how do we solve this problem? Well, let’s start by flipping the POLARITY switch again. The result of that is shown below.


The subwoofer is 0.72 m further away than the main loudspeaker. The polarity (or "phase") of the subwoofer is inverted (or "out of phase".
The subwoofer is 0.72 m further away than the main loudspeaker. The polarity (or “phase”) of the subwoofer is inverted (or “out of phase”).


As you can see in the red plot above, flipping the POLARITY or INVERT switch actually makes the problem worse now that the loudspeakers are closer together. We’re losing more “bass” at 120 Hz because we have flipped the switch. So, we’ll need to find a different solution.

Okay, let’s play with the allpass filter again. We’ll set it to 120 Hz like we did before and take a look at the result (shown below).


The subwoofer is 0.72 m further away than the main loudspeaker. The polarity (or "phase") of the subwoofer is normal. The allpass filter has been set to a frequency of 120 Hz.
The subwoofer is 0.72 m further away than the main loudspeaker. The polarity (or “phase”) of the subwoofer is normal. The allpass filter has been set to a frequency of 120 Hz.


Hmmmm… that didn’t work. Not only is the allpass (at 120 Hz)  worse than the original problem, it’s also worse than flipping the POLARITY switch (in other words, we’ve lost more bass around 120 Hz – since the dip in the red curve is deeper).

Okay, let’s fiddle with that ALLPASS or PHASE knob a little. we’ll start by turning it lower in frequency, the result of which is shown below.


The subwoofer is 0.72 m further away than the main loudspeaker. The polarity (or "phase") of the subwoofer is normal. The allpass filter has been set to a frequency of 40 Hz.
The subwoofer is 0.72 m further away than the main loudspeaker. The polarity (or “phase”) of the subwoofer is normal. The allpass filter has been set to a frequency of 40 Hz.


Hey, that worked well! Although our problem is at 120 Hz, we nearly fixed the problem by setting the allpass filter’s frequency to 40 Hz. Again, a different order of allpass, or a different distance between loudspeakers or a different anything else would have resulted in us finding a different frequency. Do not assume that 40 Hz is the magic number.

Just because I like fiddling with knobs, let’s try going the other way. We’ll turn up the allpass frequency to 240 Hz – the result of which is shown below.


The subwoofer is 0.72 m further away than the main loudspeaker. The polarity (or "phase") of the subwoofer is normal. The allpass filter has been set to a frequency of 240 Hz.
The subwoofer is 0.72 m further away than the main loudspeaker. The polarity (or “phase”) of the subwoofer is normal. The allpass filter has been set to a frequency of 240 Hz.


Hmmmm.. .that’s not good. We’ve made the problem much worse. Okay – set it back to 40 Hz (for this example…).


The moral of the story

If you go to a lot of websites, you’ll get the advice that, when setting up a subwoofer, you should put the speakers where you want them, and then fiddle with the switches and knobs so that you get the most bass. This is only partly true. As you can see above, we’re really talking about a frequency band around the “crossover region” where the signals are coming from both the subwoofer and the main loudspeakers.

In a perfect world, the subwoofer has characteristics that perfectly match the main loudspeakers, and you’ve put all of them the same distance from the listening position. This is rarely true. So, you’ll have to fiddle with something to clean up the resulting mess. However, if you just listen for “bass” you might be distracted away from where the real problem lies. Instead, set up your system and listen to the bass line (i.e. the notes played by the instrument called the bass – I don’t care if it’s electric or acoustic. If you prefer ‘celli, you can use them instead). If you notice that some notes are much quieter, you have a problem that you might be able to fix by fiddling with the subwoofer’s controls. Take them one at a time, and listen to those notes that you lost before. If you get them back, you’ve fixed the problem. If you fiddle with every knob, and you can’t get those notes, you might need to blame the musicians or the recording engineer… In fact, it will have to be their fault, because if it’s not, it might be your room, and fixing that is expensive.


Bang & Olufsen BeoPlay A9 Reviews

I was the final sound designer for the A9, so my job was deciding on its final tonal balance.

Tim Gideon of PCMag.com wrote in this review:

“The bass is intense without being over-the-top, as the system seems to primarily focus on high-mids and highs. The A9 is a crisp, bright system, balanced out by powerful low-end, for sure, but it is the higher frequencies that own the stage.”


Trusted Reviews wrote in this review:

“B&O has opted for a relatively neutral signature, but bass, mid and high frequencies all shine through with the A9 managing that difficult balancing act of tying accuracy and emotion.”


Nick Rego at tbreak.com wrote in this review:

“After all this though, how does the A9 sound? In a word, mesmerizing. The sheer power that the A9 can deliver is absolutely incredible, and if placed in a well furnished room it could be hard to figure out where this incredible sound is coming from. I decided to put the A9 to the ultimate test for a house party I was having in my back garden. I had positioned the A9 towards the top end of the garden path, and when I turned up the volume the music could be heard in almost every corner. There was no distortion at all on the music even when I cranked the A9 up as high as it could go (without waking up half the neighborhood). The A9 certainly delivers on B&O’s promise of sheer audio performance packaged in a sleek enclosure.”

… but what do they sound like out in the kitchen?

Typically, when you read a review of a loudspeaker, you’ll often see a graph that shows a measurement of its “frequency response”. This is a measurement of how loud the loudspeaker is at different frequencies at one position, directly in front of it, if you feed the same signal level into the input of the loudspeaker, and you are not in a room with reflecting surfaces. Usually a measurement like this is done by placing a microphone 1 m in front of the tweeter and putting some special signal (like a sine wave with a changing frequency or something called an MLS signal) into it. In (some persons’ ) theory, the goal of a loudspeaker is to have exactly the same output level at all frequencies (assuming that all those frequencies went into it at the same input level). In other words, output equals input.

However, that’s only a very small view of reality. For starters, this measurement is only done at one signal level. There is no guarantee that the loudspeaker will behave the same way if you measured it with a louder (or a quieter) signal. However, for the purposes of this discussion, we’ll take issue with another point. One big problem with this measurement is that it only tells you how the loudspeaker behaves at one point in space – and this is simply not enough information.

In reality, sound does not beam out of the front of a loudspeaker like a laser beam. The truth is that sound comes out of the loudspeaker and heads in all directions – left, right, up, and down. So, one question to ask is “what’s the difference in the sound that goes out the front, and the sound that goes out the side or the back?” Well, generally speaking – and this is VERY general – there is less and less energy in the high frequencies as you come around to the back of the loudspeaker. There are physical reasons for this that we’ll talk about later (or you could go look it up now, if you prefer) but we won’t get into it here.

So, let’s take a very simplified example:

front


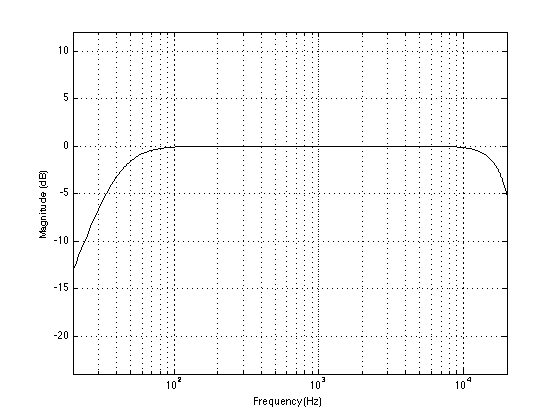
Let’s say that the plot shown above is a frequency response measurement of a loudspeaker done directly in front of it, “on-axis” to the tweeter, 1 m away. As you can see, it has an unbelievably flat frequency response (I’m faking it…) with a roll-off in the very low end (50 Hz) and the high end (18 kHz). How would the same loudspeaker measure if we were to put the microphone at the same distance, but directly to one side,  90° off-axis? Well, it might look  something like this:


side


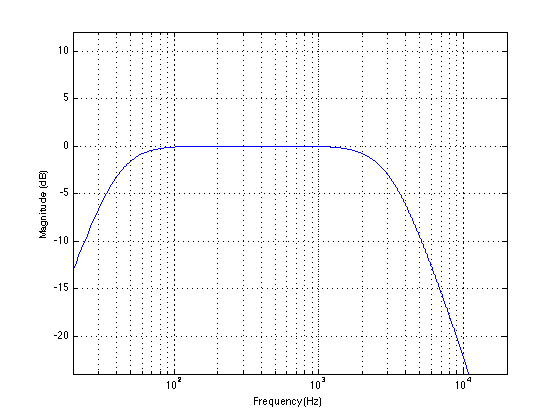
You’ll note here that the low end roll-off hasn’t changed – we have just lost high frequencies. Now let’s measure again, but this time, we’ll put the microphone directly behind the loudspeaker. In this case, we might see a frequency response measurement that look something like this:


back


So you can see there that we have the same effect – just more of it.

So, the first moral of the story here can be read two different ways:

Option 1: The further around the back of the speaker you go, the less high frequency information you’ll get – or at least, the quieter the high frequencies will be.

Option 2: Bass goes everywhere equally, but high frequencies tend to “beam” forwards.


But there is a different moral to be learned here. Usually, when you buy a lamp to hang on the ceiling to light up a room, you don’t think about how much light is beaming straight out of it, down towards one point on the floor or the wall. Usually, you think about how much light goes out in all directions at the same time – how much it lights up the room (instead of just one location in the room). The same is true for a loudspeaker. We can think about how much energy is coming out of the loudspeaker in all directions at the same time – in other words, how much energy is going out into the room, and not just what’s headed toward your left ear.

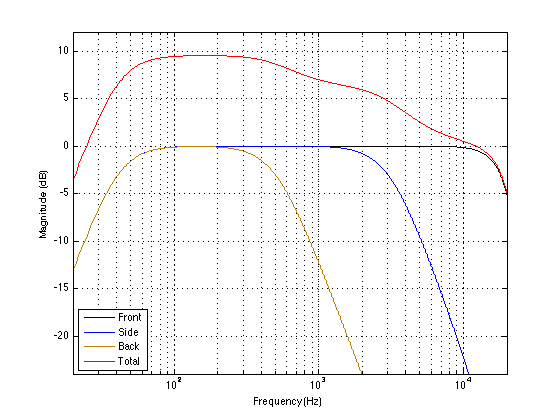
In order to consider this, we have to add up the frequency responses of the loudspeaker going out in all directions at the same time. For the purposes of this discussion, we’ll pretend to do only 3 measurements – for the front, side, and back of the loudspeaker – but let’s say that’s enough for now. If we add up the energy in the three frequency responses we saw above, we’ll get something like the one below:


total


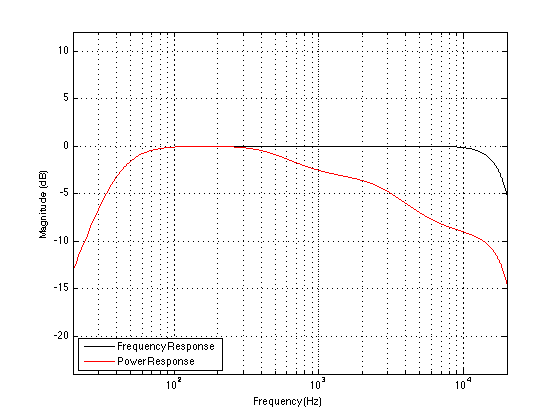
On that plot shown above, you can see the three original measurements, and the result when you add the three of them together (the red curve). In our simplified little world here, what this shows is that, if you consider the sound coming out of the loudspeaker in all directions at the same time (the red curve) you can see that there is more energy in the low frequencies than the high frequencies. So, if we normalised the two measurements (in other words, make them comparably loud (in other words, align them vertically on the graph)) and compare them directly, we see the plot show below, which shows that the power response is generally more bass-y than the frequency response.

freq_vs_power_response

So what? Well, if you turn on the music in the living room, and you head into the kitchen to make dinner, you aren’t on-axis to the loudspeakers. So the sound that you’re hearing has very-little-to-nothing to do with the black curve. What’s actually happening is that the sound radiates out of the loudspeaker in all directions at the same time, bounces around the living room and leaks into the kitchen. So, what you’re listening to has much more to do with the red curve than the black curve. If we were being more geeky, we would say that you’re listening to the loudspeaker’s “power response” (because we’re talking about the sum of the total acoustic power put into the living room) instead of its “frequency response”.

That doesn’t necessarily mean that you should try to build a loudspeaker  with a flat power response – that’ll sound really bright. However, it might mean that the frequency response curve you see in the magazine review isn’t the only thing that you should worry about… It also means that if you’re building a speaker for people  who have more than one chair in the house (or people who have friends), you might want to worry about something more than just the frequency response.

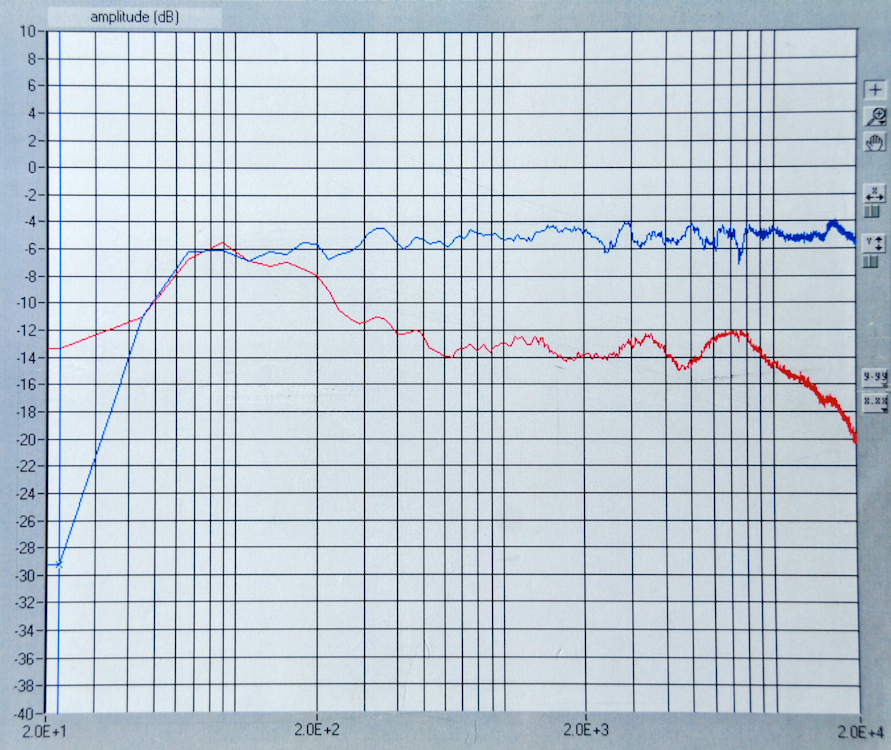
And, just in case you think that I’m oversimplifying too much here, let me prove to you that I’m not. The plots above were built on fake curves, showing what happens when I add only three measurements of a loudspeaker, one in the front, one in the side and one in the back of the device. However, take a look at the curves below. These are two real measurements of a real loudspeaker. The blue curve is the on-axis frequency response measurement (note that this is an active loudspeaker that has been equalised to have a flat-ish on-axis frequency response). The red curve is the measured power response of the same loudspeaker which was found by making a LOT of frequency response measurements around the loudspeaker and summing the results all together to get an idea of what the device was doing in all three dimensions. Looks pretty similar to the fake plot above, doesn’t it?


2013-08-27 at 11-22-49

Any port in a storm?

So, you want to build a loudspeaker…

One of the questions you’ll probably be asking yourself is whether you want to build a ported loudspeaker (sometimes called a “bass reflex” loudspeaker) or one with a sealed enclosure. If you want to know the general reasons why most people think that you should choose one or the other, go somewhere else for information – or maybe come back here later (maybe I’ll talk about it in a later posting).

For this posting, I want to look at a couple of things that I haven’t seen elsewhere – mostly because it helps me to understand the difference between ported and sealed loudspeaker enclosures a little better.

Let’s take a loudspeaker driver and put it in a box. For the purposes of this discussion, we’ll simulate a 10″ driver with mostly-real Thiele-Small parameters in a simulated sealed box. The box has a volume, but we’ll leave out any possible internal modes to keep things simple for now. We’ll also ignore additional effects such as diffraction – we’re just looking at the how the enclosure’s volume and the port dimensions affect the response of the system.

If we sweep a sine wave into the driver, keeping the voltage constant, and we measure the sound pressure level in front of the driver, we’ll see that the total system (the loudspeaker in a sealed box) acts as a minimum phase, second-order high pass filter. Therefore it has a rising slope of 12 dB/octave in the low end. The Q of that high-pass filter will be dependent on the relationship of the driver’s parameters and the size of the box.

Magnitude responses of a loudspeaker driver in a sealed cabinet. Each curve is for a different cabinet volume.

In the plots above, you can see the results on the magnitude response of changing the enclosure volume. The blue curve on the far left is the response you’d get from putting the driver in an infinite baffle (actually, I simulated an enclosure of about a cubic kilometre or so… So not quite infinite, but pretty big for a woofer cabinet…). Notice that it has the highest output at the lowest frequency, but you don’t get as much output around the knee as you do with the other curves. As the enclosure volume is made smaller (The green curve is 1000 litres, and each curve after that, moving left to right, is for a volume of one-half the previous one, so, 500 l, 250 l, 125 l, 62.5 l, 31.25 l, and 15.625 l. Remember – the driver that we’re simulating here isn’t real, so don’t worry about the actual volumes – we’re just worried about the differences in magnitude response as the volumes get smaller.)

You can see in the plots that, by making the volume behind the driver smaller, we do a couple of things at the same time.

  1. One is that, the smaller the enclosure, the higher the cutoff frequency of the resulting high pass filter. This is because the “spring” supplied by the air in the enclosure gets stiffer (or less compliant) as the box gets smaller, so it rings at a higher frequency.
  2. Secondly, you’ll notice that the Q of the high pass filter increases as the enclosure gets smaller. This is because the damping factor of the total system (which is, in turn inversely related to the Q – the lower the damping, the higher the Q) decreases as the spring gets stiffer ( and the compliance goes down), if neither the mass nor the losses in the system change.

Both of these are basically the same as having a series RLC circuit and decreasing the capacitor value. The resonant frequency will go up, and the damping factor will go down.

Now, what happens if we wanted to build a ported loudspeaker instead? For now, let’s just use the same loudspeaker driver, a 1000 litre enclosure and we’ll add a port. We’re keeping it simple, so we will just add the port as a pipe sitting outside the enclosure so it doesn’t take away from the enclosure’s volume. Also we will not include the port’s volume as part of the enclosure volume. Also, because this isn’t the real world, we’ll make the port’s output in the same physical location as the loudspeaker driver to avoid any problems with propagation delay and interference at the microphone location.

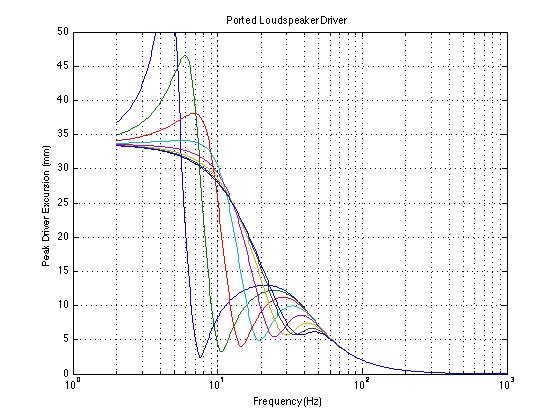
Magnitude responses of a loudspeaker driver in a ported enclosure. Each curve is for a different port length.

The above plots show the result of this imaginary ported box with different port lengths, keeping all other parameters constant. I’ve made the losses in the port low so that the port has a bigger contribution to the total magnitude response, and therefore is easier to see. Remember – we’re not simulating the real world – we’re intentionally making the simulation produce curves that show patterns to better understand what’s going on. The ports that I’ve simulated are 10 cm in diameter, and have a length of (again from left-to-right) 1.6 m, 800 cm, 400 cm, 200 cm, 100 cm, 50 cm, 25 cm, and 12.5 cm.

What can we see in these plots?

  1. Firstly, you can see that the slope of the high pass filter is now steeper than it was with the closed cabinet. This is because a ported loudspeaker enclosure results in a fourth-order high-pass system, so we have a slope of 24 dB/octave. This means that, in the very low end, we have a LOT less output from the ported system than the sealed system.
  2. Secondly, you can see that, in this case, changing the port length has an puts a bump in the output’s magnitude response around a frequency that is dependent on the port length. The longer the port, the lower the centre frequency of the bump. This isn’t a surprise, since making the port longer lowers the resonant frequency of the Helmholtz resonator. In real life, the bump probably wouldn’t be as prominent – I made it obvious by simulating a port with very low losses (Those losses are the result of things like turbulence around the ends of the port and friction where the air “plug” in the port is rubbing against the sides of the port and the energy is converted to heat.)
  3. Thirdly, you will see that the cutoff frequency of the system doesn’t change as much as it did when I was changing the volume of the sealed enclosure.

So, how do these systems compare? You’ll often hear people say “I chose to make a bass reflex loudspeaker so that I would get more bass out of the system.” The question is, does this sentence make sense? Is this really a good reason to choose a ported enclosure over a sealed one when you’re building a loudspeaker? Let’s look at what magical wonders adding a port had brought to our pretend loudspeaker…

The difference in the magnitude responses of a loudspeaker driver in a ported vs. a sealed enclosure (where all loudspeaker cabinets have the same volume). Each curve is for a different port length and the colours correspond to the previous plot. Positive values mean that the ported system is louder than the sealed system. Negative values mean the opposite.

The above plots show the difference in the output of the systems, showing the relative outputs of the ported systems (the colours are arranged to be the same as the ones in the previous plot so you know which port is which length) compared with the same enclosure without a port (in other words, the green curve from the top plot). Basically, all I’ve done here is subtracted the green curve from the top plot from all the curves in the second plot. If the result is 0 dB (as it is in the high frequency region for all of the curves, then this means that the two systems have the same output. If the value for a given frequency is positive, then this means that the ported system is louder than the sealed system. If the value is negative, then it means that the ported system is quieter by that amount.

As can be seen in that plot, there is a frequency region for all ported systems where you get more output for the same voltage. In the high end, both systems give the same output (because that’s so far above the port resonance that it’s basically not a part of the system, so they both behave the same way). In the low end, the ported system gives much less output because it’s a 4th-order high pass instead of a 2nd-order high pass like the sealed enclosure system.

So far, we can see that a ported system does appear to give you more bass for the same input voltage, assuming that you’ve tuned the port to give you more output in a band that you call bass – however, below that band, you get less. So you might be “robbing Peter to pay Paul” – which might not necessarily be a good idea.

Some people (who might know a little more about what they’re talking about than the last people I mentioned) say “I’m going to build a bass reflex loudspeaker instead of a sealed system to reduce distortion in the driver at the port resonance.” Now why on earth would they say that? Well, a little more digging (not much more digging, admittedly) will turn up an extra little piece of information: the driver moves less at frequencies around the port resonance. For example, at the resonant frequency of the port, the Helmholtz resonator acts against the driver, pushing it out when it tries to move in and pulling it in when it tries to move out. As a result, the excursion of the driver drops. In an extreme (non-real-world) case, if there are no losses in the port or the enclosure, then the driver’s excursion would be 0 at the port resonance. The greater the losses, the less this will be true.

So, let’s check out our two systems again, this time, looking at the driver excursion (peak excursion, to be precise) by frequency.

The peak excursion of the loudspeaker driver in a sealed cabinet. The different curves are for different cabinet volumes and correspond to the first plot.

The above plot shows the peak excursion of the driver in the sealed cabinet. The colours correspond directly to the curves in the first plot at the top of the posting so that you can see the kind of magnitude response you get for the excursion. As you can see, in all cases, the excursion of the driver in the high frequency region is nearly 0 mm – the higher we get, the closer we get to 0 mm. You can also see that, in the low end, the excursion levels out. The more level the excursion plot, the closer the slope of the magnitude response is to a “perfect” 12 dB/octave. This is because the sounds pressure only comes from the air moved by the driver, and because the sound pressure level is proportional to the acceleration of the driver. As the frequency drops and the excursion stays the same, the acceleration drops by 12 dB per halving of frequency because it’s the derivative of the velocity which drops by 6 dB per halving of frequency, because it’s the derivative of the excursion in time.

Of course, if your driver can’t handle the excursions we see here (for example, the one I’m using for this simulation can only move 8 mm before it starts to get unhappy) then you might have something to worry about here. How you deal with that problem, however, is your problem.

So, what would the excursion look like for the same driver in a ported cabinet? Let’s have a look!

The peak excursion of the loudspeaker driver in a ported cabinet. The different curves are for different port lengths and correspond to the second plot.

The plot shown above has the peak excursion curves for the same driver in the ported cabinet for the port lengths listed high above… As you can see, starting at the top end, the excursion of the driver is nearly 0 mm, just as in the case of the sealed cabinet. As the frequency drops, the excursion starts to increase. However, then something weird happens. Going lower in frequency, we can see that the driver excursion levels out and starts to drop, with a minimum value at the resonance of the port. If you’re very attentive, you’ll notice that this frequency isn’t exactly the same as the frequency of the bump in the total system’s magnitude response. That’s not a big surprise, since there is some other frequency (in this weird, non-real-life system) where the summed outputs of the driver and port give you more output than they do at the port resonance (actual results may vary). Anyway, going below the port resonance, you can see that the excursion of the driver really takes off and becomes much greater than it was with the sealed system. That’s because there’s nothing there to stop it. At frequencies that are much lower than the port resonance, the system behaves as if the driver wasn’t in a box at all, so it’s free to move as far as it wants to go. (remember that our non-real-life system isn’t limited by things like the maximum excursion of the suspension… The values in the plot show the excursion that the driver “wants” to hit – it’s just held back by real life.)

So, you may be asking yourself a question at this point: “Why is it that, at very low frequencies, the driver’s excursion is much higher in the ported system than in the sealed system, but you get less output?” Good question! The reason is that, at frequencies far below port resonance, you get almost as much output from the port as the driver. The only problem is that the port is just delivering the pressure at the back of the driver to the outside world. So, when the front of the driver goes positive, the back of the driver (and therefore the port) goes negative, and the two cancel each other at the listening position. Putting the port opening at the back of the loudspeaker won’t help much. It will just make the propagation distance a little longer, therefore a little later, but they’ll still cancel each other. This is why the total output of the ported system drops faster as you go lower in frequency – the lower you go, the more the driver and the port cancel each other. They’re both working really hard (and therefore, so is your amplifier), but you get next-to-nothing.

However, let’s back up a bit. There is that issue of the lower driver excursion around the port resonance. This is true. So, if you have a loudspeaker driver that doesn’t like excursion (maybe, say, it distorts when it moves to far) in a particular frequency band, then maybe a port could alleviate the problem. However, beware of frequencies below! Danger danger! (In other words, you might want to put a high pass filter in your system to keep things running smoothly below the port resonance…)

The difference in the peak excursion of a loudspeaker driver in a ported vs. a sealed enclosure (where all loudspeaker cabinets have the same volume). Each curve is for a different port length and the colours correspond to the previous plot. Positive values mean that the loudspeaker driver in the ported system moves further than that in the sealed system. Negative values mean the opposite.

A couple of plots ago, we did some subtraction to compare the magnitude responses of the ported systems to a sealed system. Let’s do the same for the excursion plots. The above figure shows the difference between the peak excursion of the driver in the ported systems, and that of the driver in a sealed enclosure of the same volume. Negative values mean that the ported cabinet driver moves less than the sealed cabinet one. Positive values mean that the ported cabinet driver moves further than the sealed cabinet one.

As you can see in those curves, in the high frequencies, the driver will have the same excursion in both cases. Secondly, there is some region in all cases where the driver moves less in a ported system than in a sealed cabinet of the same volume. At low frequencies, the ported cabinet driver moves further than the sealed cabinet equivalent (yet has less total output, remember!). An interesting detail to note here is to look carefully at this plot with the magnitude difference plot. For example, take a look at the left-most blue curve. The ported system driver has a lower (or equal) excursion than the sealed system driver from about 6.5 Hz and up. Looking at the magnitude response difference curve for the same system, we can see that we get about 6 or 7 dB more output from the ported system at 6.5 Hz, with less and less benefit as we go higher in frequency. Below 6.5 Hz, although we get more output from the ported system for about an octave, it comes at the cost of a much greater excursion, which would probably not be good for our driver.

So what?

Okay, let’s be honest here. I’ve made two very simulated systems, and only changed one variable in each system to see what happens. And, I can absolutely guarantee that (1) no loudspeaker driver in the world has the parameters of the one I’ve simulated and (2) if you built the system I’ve simulated, it wouldn’t behave as I’ve shown here. This is a very isolated, idealised simulation, intentionally designed to make the changes I was making obvious. However, the issues that I’ve made obvious are basically true – I’ve just done a little exaggeration…

What’s the moral of the story? Well, I’m not really sure of all of them. One moral is certainly “sticking a port on a loudspeaker enclosure is not a free ticket to more bass”. Another moral is “people who use ports to reduce driver excursion might not know what they’re talking about”. Probably the most important moral is “don’t trust everything you read” – even the stuff you read here.

Post Script

If you REALLY want to learn this stuff correctly, go read the following:

Closed Box Loudspeaker Systems – Part 1: Analysis

Closed Box Loudspeaker Systems – Part 2: Synthesis

Vented Box Loudspeaker Systems – Part 1: Small Signal Analysis

Vented Box Loudspeaker Systems – Part 2: Large Signal Analysis

Vented Box Loudspeaker Systems – Part 3: Synthesis

Vented Box Loudspeaker Systems – Part 4: Appendices

When you’re done with those, please explain them to me.