B&O Tech: BeoLab 90 – Behind the scenes

#41 in a series of articles about the technology behind Bang & Olufsen loudspeakers


Most loudspeaker projects at Bang & Olufsen are conceived in the design or the Product Definition department. This means that someone decides something like “we’re going to make a loudspeaker, this size with this design” and then the project arrives at the Acoustics Department to find out whether or not the idea is feasible. If it is, then it continues through the development process until we reach the end where the is a product in a store. A better description of this process is in this posting.

BeoLab 90 was different. Instead of being a single project that began, evolved, and ended, it was more like a number of little streams coming together to form a river. Each stream was an idea that contributed to the final product.

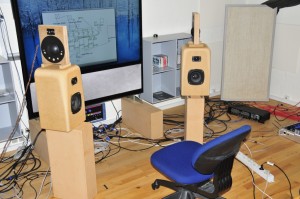
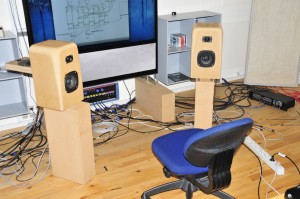
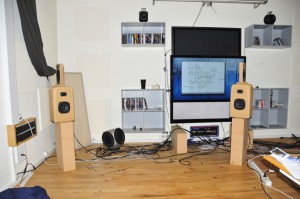
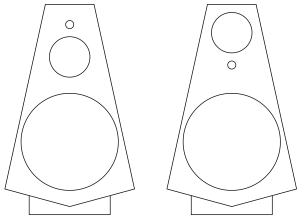
One of the early “streams” was an idea that was hatched in the Acoustics Department itself around 2009. I went to the head of the department at the time, and offered to make a deal. If I were to pay for all the components personally, could I use my work hours and B&O resources (like the Cube) to build a pair of loudspeakers for home. These would be a “one chair – no friends” style of loudspeaker – so it would not really be a good candidate for a B&O loudspeaker (our customers typically have friends…). In return, I would keep the loudspeakers in the listening room at B&O for an extended time so that we could use them to demo what we are capable of creating, without our typical restraints imposed by design, development time, size, “normal” product requirements (like built-in amplifiers and DSP), and cost of components.

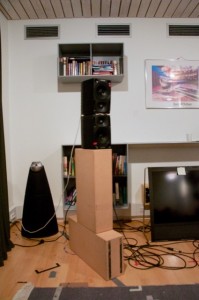
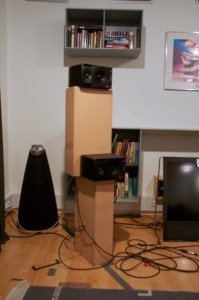
By early 2011, these loudspeakers were built (although not finished…) and ready for measurements and tuning. The photo below shows the “raw” loudspeaker on the crane in the Cube going out to be measured.
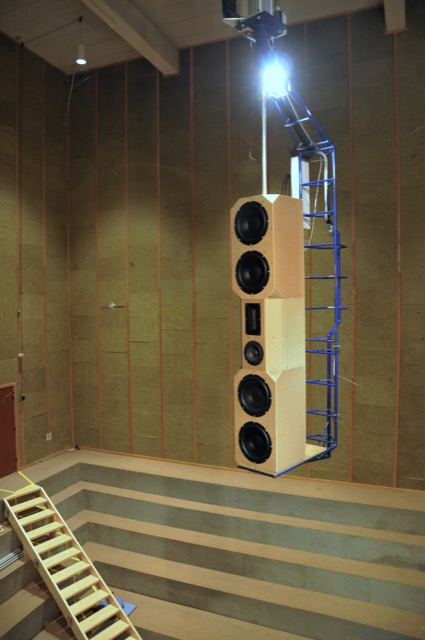
 

One of the original "seeds" that began the discussions about whether BeoLab 90 should be considered.
Figure 1. One of the original “seeds” that began the discussions about whether BeoLab 90 should be considered. The woofers are identical to the BeoLab 9 10″woofer. The mid-bass is a Scan-Speak 5 1/4″ Illuminator. The tweeter is a Fountek Pro5i ribbon.

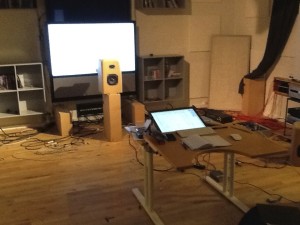
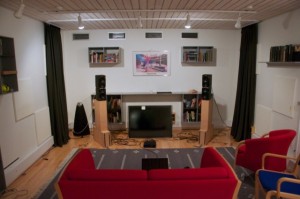
Those loudspeakers lived in Listening Room 1 for about a year. We’re bring people in for a “special demonstration” of a loudspeaker behind the curtain. The general consensus was that the loudspeakers sounded great – but when the curtain was opened, many people started laughing due to the sheer size (and the ugliness of my design, apparently…) of the loudspeakers.
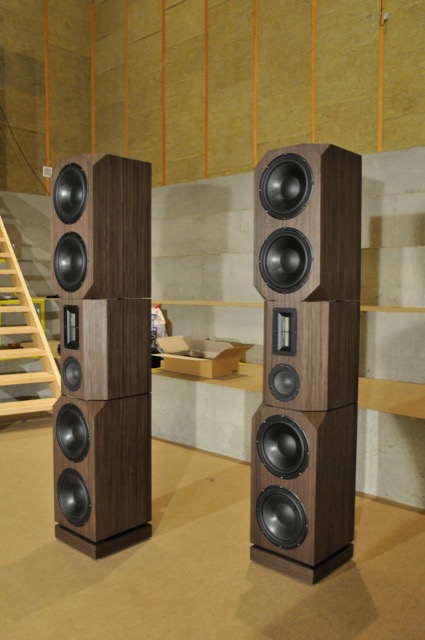
 

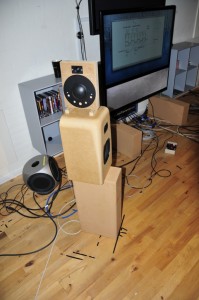
Figure 1a - the finished version.
Figure 2: The finished version.

The second “stream” was an idea that was born from Gert Munch’s goal of building a loudspeaker with a smooth power response as well as a flat on-axis magnitude response. The experiment was based on a “normal” two-way loudspeaker that had an additional side-firing dipole on it. The basic idea was that the two-way loudspeaker could be equalised to deliver a flat on-axis response, and the dipole could be used to correct the power response without affecting the on-axis sound (since the on-axis direction is in the “null” of the dipole). For more details about this project, please read this post.
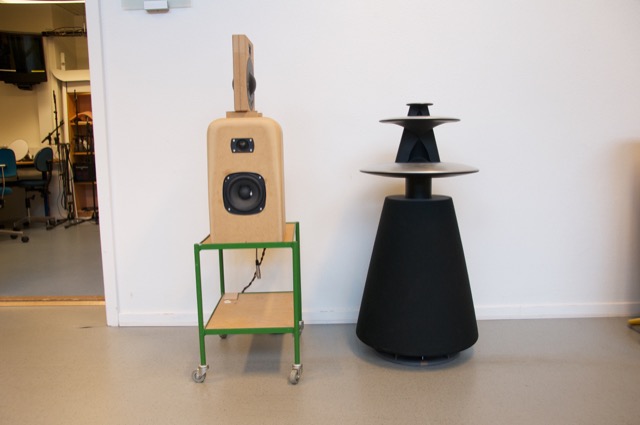
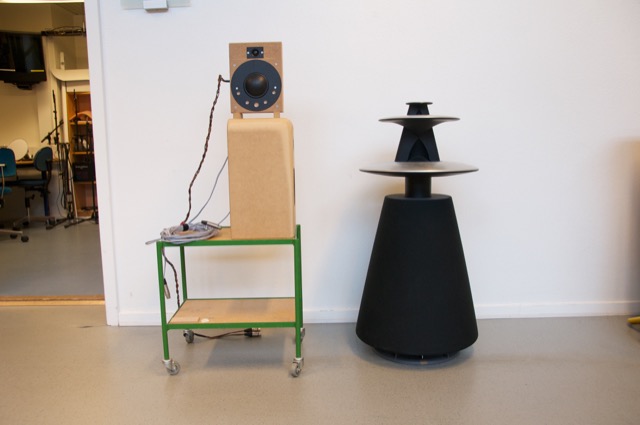
 

The "Shark Fin" loudspeaker - an experiment attempting to independently tune the power response without changing the on-axis frequency response.
Figure 3: The “Shark Fin” loudspeaker – an experiment attempting to independently tune the power response without changing the on-axis frequency response. See this posting for more information.


The "shark-fin" loudspeaker - side view.
Figure 4: The “shark-fin” loudspeaker – side view.


The "shark-fin" loudspeaker during the listening portion of the experiments in Listening Room 1.
Figure 5: The “shark-fin” loudspeaker during the listening portion of the experiments in Listening Room 1.


After the “shark fin” experiment, we knew that we wanted to head towards building a loudspeaker with some kind of active directivity control to allow us to determine the amount of energy we sent to the nearby walls. Two members of the Acoustics Department, Gert Munch and Jakob Dyreby, had been collaborating with two graduate students (both of whom started working at B&O after they graduated), Martin Møller and Martin Olsen on exactly this idea. They (with Finn Agerkvist, a professor at DTU) published a scientific paper in 2010 called “Circular Loudspeaker Arrays with Controllable Directivity”. In this paper they showed how a barrel of 24 small loudspeaker drivers (each with its own amplifier and individualised DSP) could be used to steer a beam of sound in any direction in the horizontal plane, with a controlled beam width. (That paper can be purchased from the Audio Engineering Society from here.)
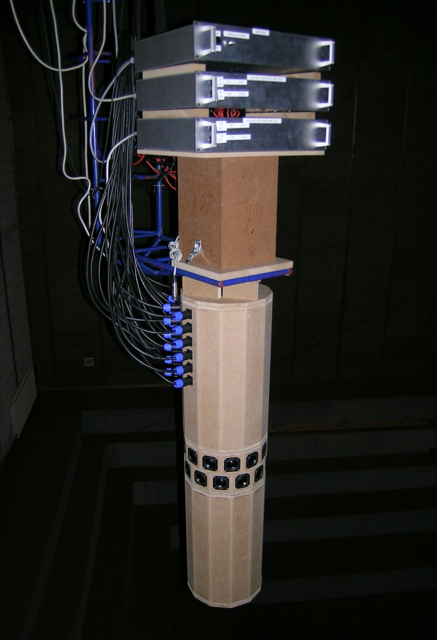
The results of a research project using 24 drivers placed radially symmetrically on a barrel. The boxes on the top are the amplifiers, one for each driver.
Figure 6: The results of a research project using 24 drivers placed radially symmetrically on a barrel. The top box is the DSP which feeds the bottom two boxes containing the amplifiers, one for each driver. The assembly is placed on the crane in the Cube.


The next step was to start combining these ideas (along with other, more developed technologies such as Thermal Compression Compensation and ABL) into a single loudspeaker. The first version of this was an attempt to reduce the barrel loudspeaker shown in Figure 6 to a reasonable number of loudspeaker drivers. The result is shown below in Figure 7.
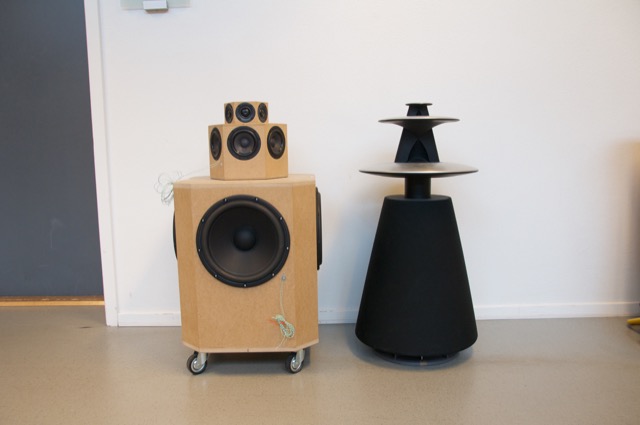
 

Prototype 1. The original idea was a loudspeaker that could act a little like a lighthouse. The beam would be rotatable in any direction. There are 6 tweeters and 6 midranges arranged in a hexagon. The 4 woofers are arranged as a square.
Figure 7: Prototype 1. The idea for this version was a loudspeaker that could act a little like a lighthouse. The beam would be rotatable in any direction. There are 6 tweeters and 6 midranges arranged in a hexagon. The 4 woofers are arranged as a square. This version failed due to the lobing of the drivers – essentially, they are too far apart to result in an adequately-controlled beam.

This first prototype had a hexagonal arrangement of tweeters and midranges (6 of each) and a square arrangement of woofers. Each driver had its own DSP and amplification with customised filters to do the “usual” clean-up of magnitude response in addition to the beam steering much like what is described in the AES paper.

Unfortunately, this version was not a success. The basic problem when trying to do directivity control actively is that you need the loudspeaker drivers to be as close together as possible to have control of the beam width in their high-frequency band – but as far apart as possible to be able to control their low-frequency band. In the case of prototype 1, the drivers were simply too far apart to result in an acceptably constant directivity. (In other words, the beam width was different at different frequencies.) So, we had to try to get the drivers closer together.


For the second prototype (shown below in Figure 8, 9, and 10) we decided to try to forget about a steerable beam – and just focus (forgive the pun) on a narrow beam with constant directivity (the same beam width at all frequencies). In addition to this, we experimented with a prototype 8mm supertweeter that would take care of the band from about 15 kHz and up.
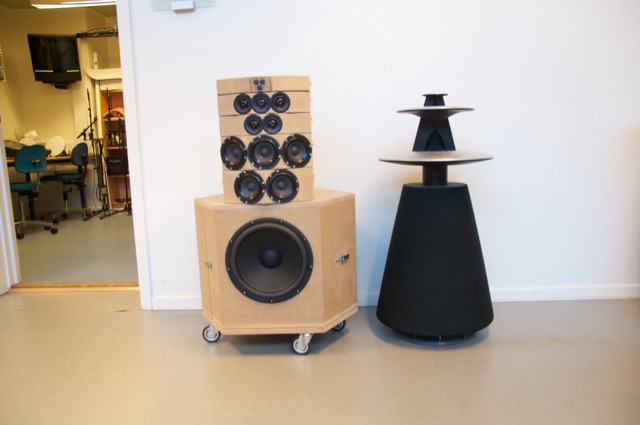
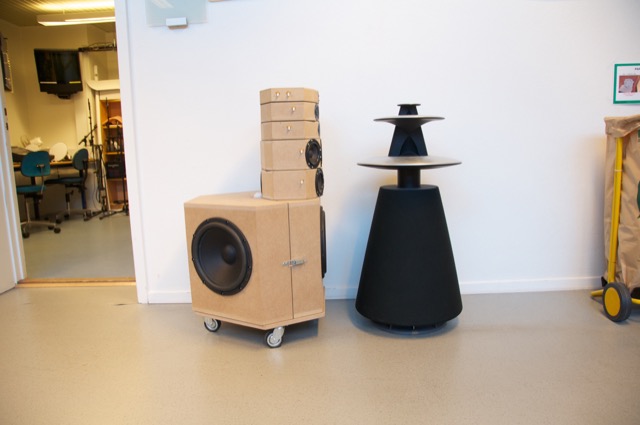
 

Prototype 2. This version did not have a rotatable beam, but it did have the capability of creating a very narrow beam due to the cluster of 5 midranges and 5 tweeters. Notice as well the cluster of prototype 8 mm supertweeters.
Figure 8: Prototype 2. This version did not have a rotatable beam, but it did have the capability of creating a very narrow beam due to the cluster of 5 midranges and 5 tweeters. Notice as well the cluster of prototype 8 mm super tweeters on the top. Also note that this version used 3 woofers instead of 4.


Prototype 2: side view
Figure 9: Prototype 2: side view


Prototype 2: Back view
Figure 10: Prototype 2: Back view

Although Prototype #2 sounded great in the sweet spot, it lacked the versatility of the first prototype. In other words, it was an amazing loudspeaker for a person with one chair and no friends – but it was not really a good loudspeaker for sharing… So, we started working on a third prototype that merged the two concepts – now called “Beam Width Control” and “Beam Direction Control”. The result in shown below in Figures 11, 12, and 13.

As you can see there, the “cluster” of 3 tweeters and 3 midranges comes from prototype 2 – but we re-gained side-firing drivers and rear-firing drivers to be able to steer the sound beam in either of 4 directions. The Beam Width could only be controlled for the front-firing beam, since it is a product of the cluster. You’ll also notice that the super tweeter was still there in this prototype. However, we also changed to a different tweeter and were starting to question whether the extra 8mm driver (and its amplifier, DAC and DSP path) would be necessary.
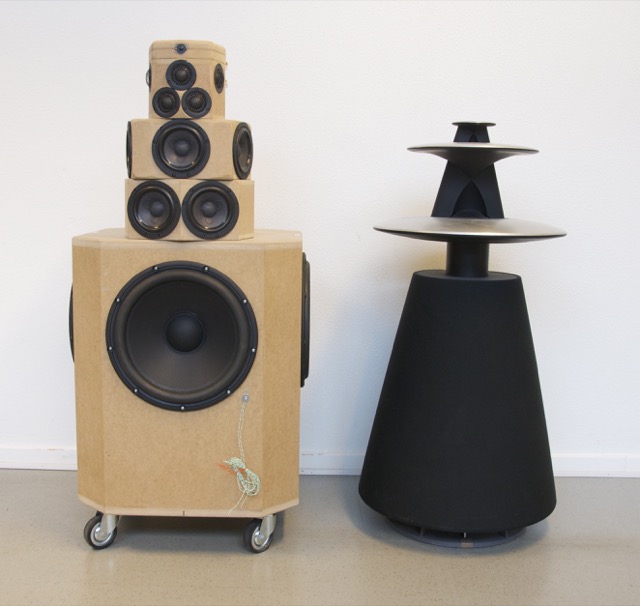
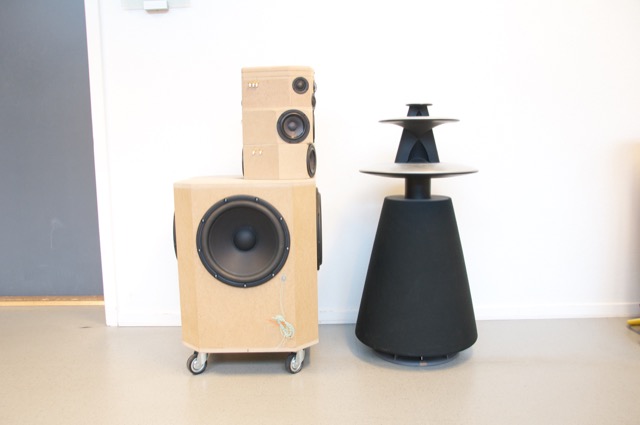
 

Prototype 3. This version had almost as narrow a beam as the previous prototype, with the ability to steer the beam in 4 directions.
Figure 11: Prototype 3. This version had almost as narrow a beam as the previous prototype, with the ability to steer the beam in 4 directions. The wired hanging from the front of the woofer cabinet connect to a thermal sensor on the magnet. At this point, we were still wondering whether to use an 8 mm supertweeter (on the top). It was eventually decided to not use this driver, since the Scan-Speak tweeters measure up to 40 kHz.


Prototype 3: Side view
Figure 12: Prototype 3: Side view


Prototype 3: back view
Figure 13: Prototype 3: back view


One thing that any good acoustical engineer knows is that corners cause diffraction. This is well-known at B&O as you can read here. Looking at the enclosure for the midranges and tweeters in the three previous figures, you can see many flat surfaces and corners – which, we assumed, were bad. So, we set about on an informal experiment to find out what would happen if we smoothed out the corners in an effort to reduce diffraction – or at least to change it. This was initially done by applying putty to the MDF enclosures and measuring the off-axis response of the result. One example of this (in progress of bring coated with putty – this was not the final version – it’s just there to show the process) is shown below in Figure 14.
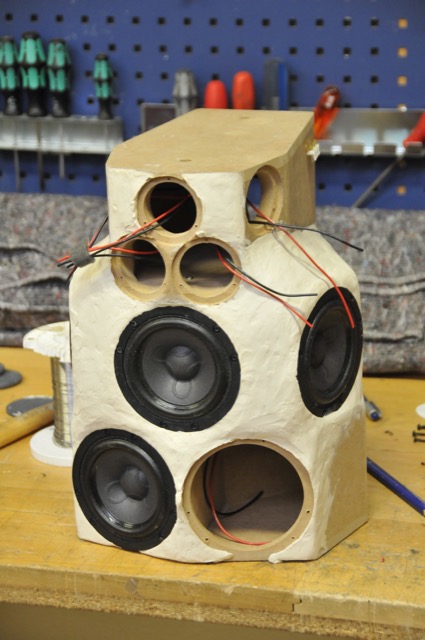
 

One of the tests for Prototype 3 was to find out whether there was a problem with diffraction due to the hard corners in the top cluster. Smoothing the shape with putty was done by hand.
Figure 14. One of the tests for Prototype 3 was to find out whether there was a problem with diffraction due to the hard corners in the top cluster. Smoothing the shape with putty was done by hand.


Surprisingly, we found out in these tests that the “smoothing” of the structure around the midranges and tweeters either made no difference or made things worse. So, we continued on, knowing that the final result would be “smoother” anyway…

While that work was going on in the Cube, a third “stream” for the project was underway – the development of the Active Room Compensation algorithm. In the early versions, it was called “ASFC” or “Active Sound Field Control” – but as time went on and the algorithm evolved, we changed to a different system and gave it a different name. Photo 15, below, shows the listening room during one of the tests for the original algorithm. I count 9 microphones in there – but there may be more hiding somewhere.
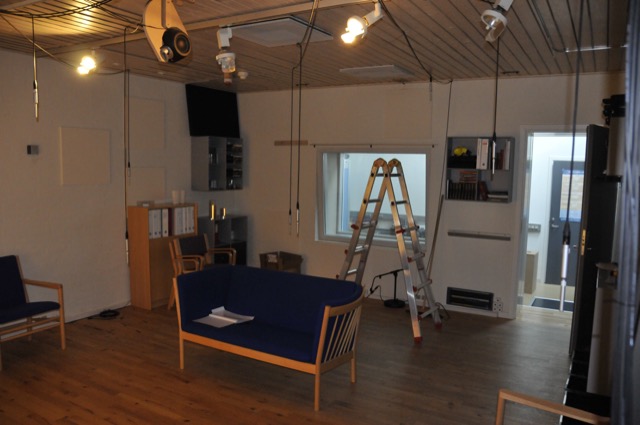
 

One of the early Active Room Compensation experiments. Notice the 18 microphones distributed around the room.
Figure 15: One of the early Active Room Compensation experiments. Notice the many microphones distributed around the room. (I count at least 8 mic’s there…)


All of the prototypes shown above are just loudspeaker drivers in MDF enclosures. All of the DSP and amplification (in a worst-case, 17 channels in total per loudspeaker) were outside the loudspeakers. In addition, the amplifiers needed active cooling (a fancy way to say “fans”) so they had to be in a different room due to noise. The photo below shows the rack of DSP boxes (on top) and amplifiers (4 channels per box) used for the prototyping.
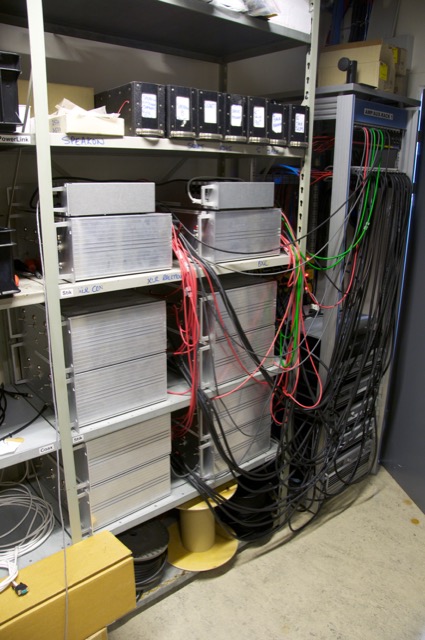
 

The electronics needed to drive the prototypes. The left stack is for the left loudspeaker, the right stack is identical. the top box is the DSP prototype with 1 analogue input channel and 20 line outputs. The remaining 5 boxes contain ICEpower amplifiers - 4 channels per enclosure.
Figure 16. The electronics needed to drive the prototypes. The left stack is for the left loudspeaker, the right stack is identical. The top box is the DSP prototype board with 1 analogue input channel and 20 line outputs. The remaining 5 boxes contain ICEpower amplifiers – 4 channels per enclosure.


While this equipment was being used to evaluate and tune the complete prototypes, a parallel project was underway to find out whether we could customise the amplifiers to optimise their behaviour for the use. For example, if you know that an amplifier will only be used for a midrange driver, then it doesn’t need to behave the same as if it were being used for a full-range loudspeaker. I’ll describe that development procedure in a future blog posting, since it’s interesting enough to deserve its own story.


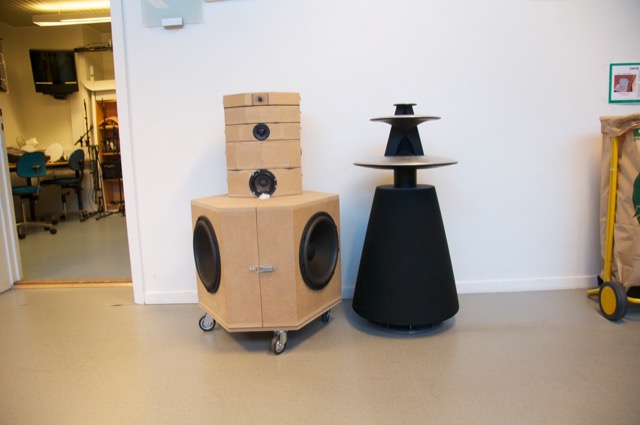
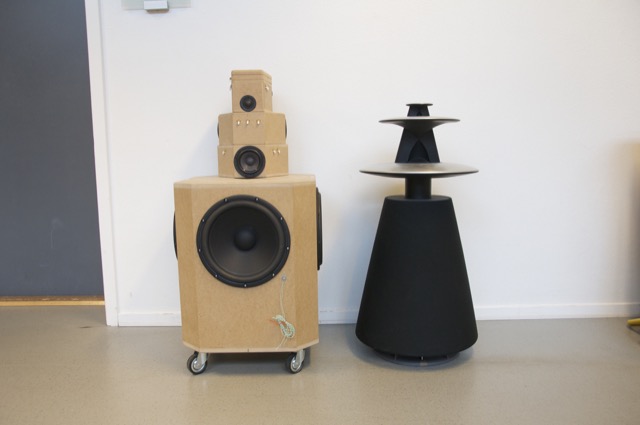
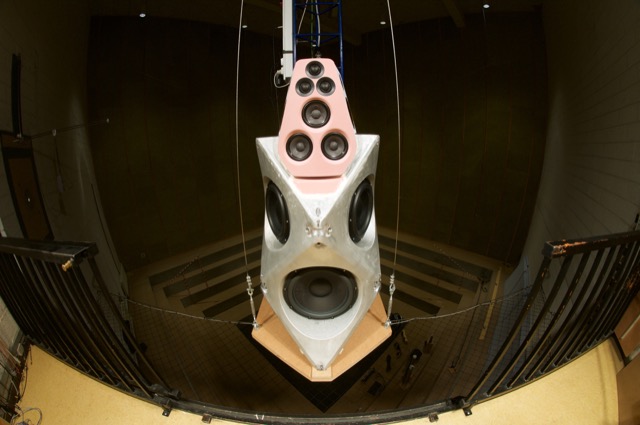
Finally, we were at a point where we built a first prototype of the “real thing”. This was hand-built using 3D-printed parts and a lot of time and effort by a lot of people. The first example of this stage is shown below on the crane in the Cube, sitting next to Prototype #4 for comparison. Notice that, by now, we had decided that the supertweeter was unnecessary, since the Scan-Speak tweeter we’re using was reliable up to at least 40 kHz. The only significant difference between the 4th prototype and the mechanical sample is that the wooden version has only one tweeter and one midrange pointing directly backwards. The “real thing” has two, aimed slightly towards the Left Back and Right Back. (See the Technical Sound Guide for more detailed information about this.)
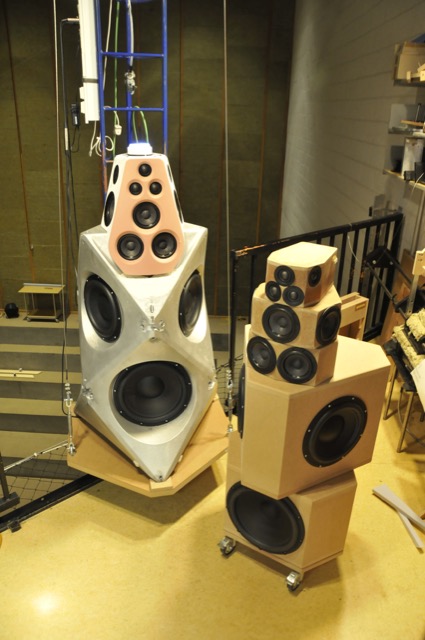
 

Prototype 4 (on the floor) was basically the same as Prototype 3, but with a different woofer arrangement. Instead of 4 matched 13" drivers, this version used three 10" drivers and one 13" in the front. On the crane is the first sample with the original mechanical design.
Figure 17 Prototype 4 (on the floor) was basically the same as Prototype 3, but with a different woofer arrangement. Instead of 4 matched 13″ drivers, this version used three 10″ drivers and one 13″ in the front. On the crane is the first sample with the original mechanical design.


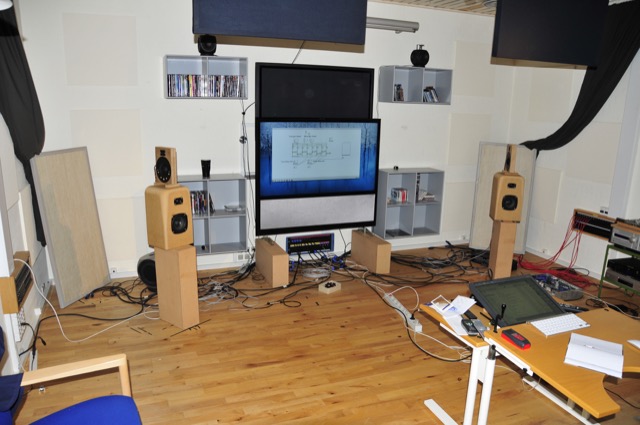
Once the measurement of the first mechanical samples were done and the correct filters programmed into it, it was time to move a pair into the listening room to see (or, more importantly, to hear) if they performed the same as the wooden prototypes. The first setup of device numbers 2 and 3 (the first one stayed with the electronics team for testing) in Listening Room 1 in Struer is shown below in Figure 18. For reference, the room is 6 m deep x 5 m wide – and that’s a 55″ BeoVision 11 on the wall.
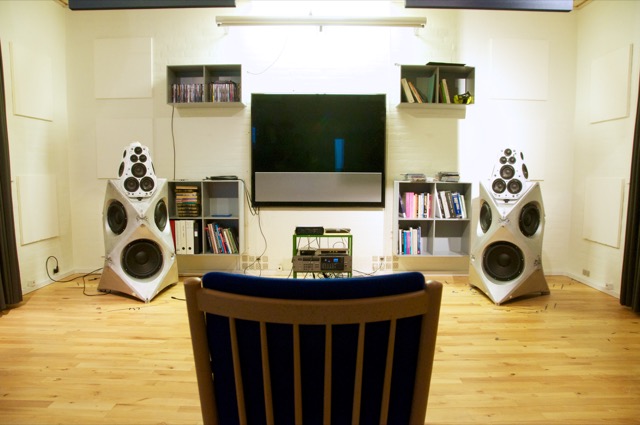
 

The first two samples in the listening room. These have internal electronics and did not require the external DSP or amplification.
Figure 18: Samples #2 and 3 in the listening room (they’re still there today, since this is the “master reference” pair). These have internal electronics and did not require the external DSP or amplification.


When we did the measurements on the samples shown in Figure 18 – both in the Cube and in the listening room, we could see that there was an unusual (and unexpected) dip in the on-axis magnitude response of about 1 dB at around 8o0 Hz. Unfortunately, it did’t seem to be easily correctable using filtering in the DSP, which meant that it was probably the result of a reflection somewhere off the loudspeaker, cancelling the direct sound at the listening position. After a day or two of playing with putty placed in various locations around the loudspeaker, we found that the problem was caused by  a reflection off the “shelf” just below the face of the top unit. That can be seen in Figure 19, below.
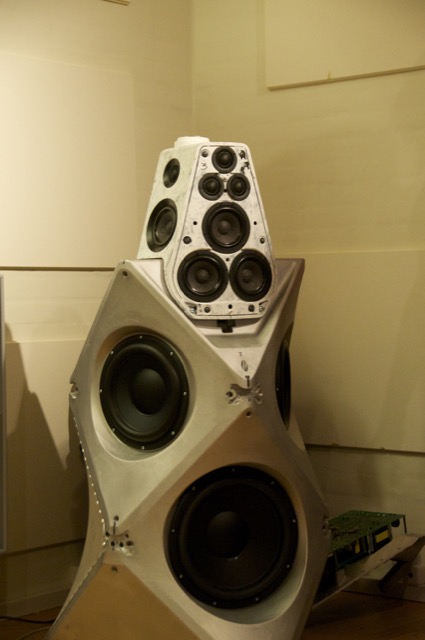
 

A closeup of the sample. The "shelf" below the midranges caused a reflection at the listening position from the top midrange. This resulted in an approximately 1 dB dip at about 800 Hz. This was fixed, resulting in a new shape, shown below.
Figure 19:  The “shelf” below the midranges caused a reflection at the listening position from the top midrange. The result was an approximately 1 dB dip at about 800 Hz. This was redesigned, resulting in a new shape, shown below.


The way to correct this problem was to bring the height of the shelf up, which also meant that it was closer to the face of the top cluster. (Note that the front panel is missing in Figures 19 and 20 – the actual face is the pink panel seen in Figure 22.) This fixed the problem, but it meant changing the mould for the aluminium enclosure. In the meantime, while that change was happening, we were able to 3D-print an insert of the same shape that could be used for the listening reference pair of loudspeakers. This meant that we didn’t have to wait for the new aluminium versions to start tuning.
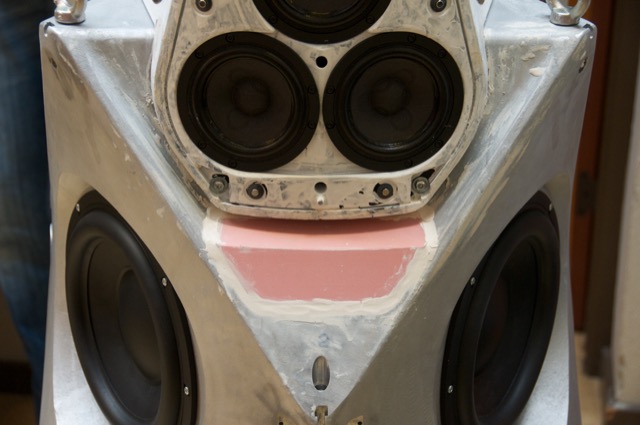
 

The fix for the "shelf". The pink 3D-printed portion raised the shelf closer to the midranges and is almost flush with the faceplate that is mounted in front of the loudspeaker cluster.
Figure 20: The repaired “shelf”. The pink 3D-printed portion raised the shelf closer to the midranges and is almost flush with the faceplate that is mounted in front of the loudspeaker cluster. The bad paint job on the top loudspeaker enclosure is a sealant. The enclosure is 3D-printed plastic which (we found out) is not airtight, to it had to be sealed to eliminate leaks.

Of course, the electronics team developed their components on a test bench, piece by piece. Eventually, all of those pieces came together into a single unit (minus the loudspeaker drivers and enclosures) which could be used for testing and software development. An example of one of those test boards (actually, the first one of its kind to be made – and one of the few with all of the amplifiers attached…) is shown below in Figure 21.


I’ll probably show some better photos of the DSP board in a later posting.
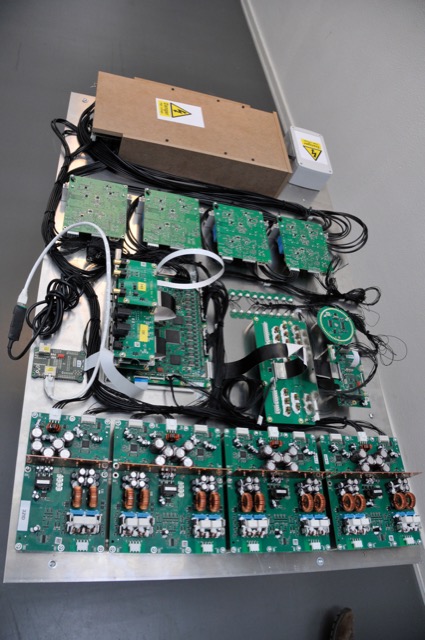
 

The entire electronics assembly for the BeoLab 90. The top portion in the brown MDF box is the power supply. Moving down the photo, the 4 PCB's are the woofer amplifiers. Next are the input and DSP boards. (Note the 18 DAC's in a row on the DSP board.) On the bottom are the 14 ICEpower amplifiers.
Figure 21: The entire electronics assembly for the BeoLab 90. The top portion in the brown MDF box is the power supply. Moving down the photo, the 4 PCB’s are the woofer amplifiers. Next are the input and DSP boards. On the bottom are the 14 ICEpower amplifiers. The circle not he right is the light ring comprised of 72 LED’s.

Finally, everything came together into a product that, acoustically and electrically, was identical to the production model. This is the version that we use for sound design. It’s shown (about to go out into the Cube for yet another round of measurements) in Figures 22 and 23, below.
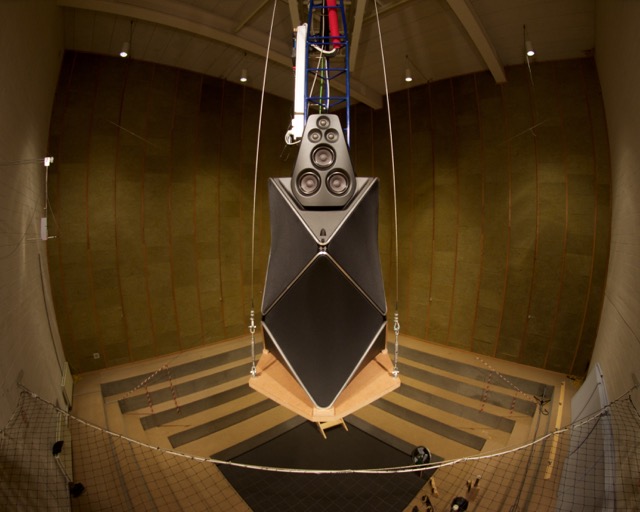
 

The early sample, on the crane in the cube, undergoing measurements to ensure that it is ready to start the sound design process.
Figure 22: The early sample, on the crane in the cube, undergoing measurements to ensure that it is ready to start the sound design process.


bl90
Figure 23: An early production mode in the Cube.


Mysterious Microphone Myths

B&O received a question on one of its social media sites this week, and I was asked to write up an answer. The question was:

Hi Bang & Olufsen

I just wanna be sure of a myth that’s been going around my audio community recently. The myth is that condenser microphones are more prone to produce feedback than dynamic microphones as a result of higher sensitivity in (and reproduction of) the treble.

Is this true of false? Thanks.


The short answer

This is false.


The long answer

Feedback happens when you have a system where the input to a microphone is amplified and sent to the output of a loudspeaker, AND the output of the loudspeaker is received at the microphone at a level loud enough to cause the signal to get louder (instead of quieter) each time it circulates through the system. The result is a “howling” or “squealing” sound from the loudspeaker. This effect will happen first at whatever frequency has the highest gain (amplification) in the system.

That frequency could be due to a peak in the magnitude response of the microphone or the loudspeaker, or some acoustical effect of the room (such as a room mode), or something else. (For example, if you put your hand over the microphone diaphragm, making a resonant cavity, you could result in a peak in the total system’s magnitude response that would not be there if you moved your hand away.)


So, the basic problem is one of signal gain. The higher the gain (or “amplification”) of the signal, the more likely you are to have feedback. The question is: what determines this total loop gain in a typical sound reinforcement system?

  • the sensitivity of the microphone
    • This is frequency-dependent, since the magnitude response of the microphone is likely not perfectly flat.
    • It is also spatially dependent. If you have an omnidirectional microphone and a cardioid microphone that have the same sensitivity on-axis (in front of the microphone), they will be very different behind the microphone. Also note that this directional pattern is also frequency-dependent. A cardioid is not a cardioid at all frequencies…
  • the gain of the microphone pre-amplifier
  • the additional gain applied after the microphone preamplifier
    • this may be frequency-dependent, like an EQ applied to the microphone signal, or an EQ applied to the entire mix sent to the loudspeaker amplifiers
  • the gain of the loudspeaker amplifier(s)
  • the sensitivity of the loudspeaker(s)
  • the distance between the loudspeaker(s) and the microphone
  • the radiation pattern of the loudspeaker(s)
    • many loudspeakers are directional, so they’re louder in front than behind
    • this is also frequency-dependent. Bass is usually omnidirectional, high frequencies are usually directional
  • the orientation of the microphone relative to the loudspeakers (i.e. is the loudspeaker in front of, or to the rear of the microphone), especially if the microphone is directional (like a cardioid or a hypercardioid pattern)
  • the coupling to room modes due to
    • the strength of the modes themselves (a function of the room construction and its materials)
    • the location of the loudspeaker(s)
    • the location of the microphone

There may be some other things – but that’s certainly enough to worry about.


IF you have two microphones, one is a dynamic microphone and the other is a condenser microphone, and they both have the same polar patterns,  the same magnitude responses, the same sensitivities, they’re both in the same location in the room with the same orientation to the loudspeakers, and all other components in the system are identical, THEN the risk of getting feedback with the two mic’s is identical.

IF you have two microphones with different polar patterns, different magnitude responses, different different sensitivities, etc. etc. THEN the risk of getting feedback with the two mic’s is different. Whether the basic electromechanical construction is based on a condenser or a dynamic design is not the cause of the difference.


That said, it is true that microphones  (both condenser and dynamic) are built with particular uses in mind. For example, (dynamic) Shure SM58 is designed to be tolerant of noises caused by it being hand-held (the diaphragm assembly is vibration-isolated from the housing) this is not true of a (condenser) AKG 451 which is designed to be mounted on a stand and not touched while you’re using it. However, this difference is not caused by the fact that one is dynamic and the other is a condenser – it’s a result of the mechanical designs of the microphones housing the “business end” of the devices. (Note, however, that this example has nothing to do with feedback – it’s just an example of microphones being designed for different purposes.)

It is also true that many condenser microphones have a magnitude response that extends to the high frequency bands with less roll-off than many dynamic microphones (there are exceptions to this statement – but I used the word “many” twice…). And, a higher sensitivity in any frequency band will result in a greater risk of feedback. However, this increased risk is a result of the magnitude response of the microphone – not its electromechanical construction. If you have a condenser microphone with a roll-off in the high end (say, an older, large-diaphragm mic, especially off-axis) and a dynamic microphone with an extended high-frequency range (i.e.  a ribbon microphone, which typically has a flatter high-frequency response than a moving-coil microphone), then the dynamic will be at higher risk of feedback.


So, like I said at the start – the myth is false. If you get feedback in your system, it’s because

  • the person running the system was not paying attention to the gain
  • the person with the microphone moved too close to a loudspeaker while the person running the system was not paying attention to the gain

Either way, it’s the fault of the person controlling the system – not the construction of the microphone. As the old saying goes: “It’s a poor craftsman that blames his tools.” Or, as a friend of mine once told a class he was teaching: “If it’s too quiet, you turn it up. If it’s too loud, you turn it down. That’s the way I remember it.”

Hope this helps.

B&O Tech: Active Room Compensation – Some Details, Part 1

#40 in a series of articles about the technology behind Bang & Olufsen loudspeakers


Once-upon-a-time, I wrote a posting explaining why a loudspeaker’s biggest enemy is your listening room. The basic problem is as follows:

  • when you listen to a loudspeaker in a room, roughly 99% or more of what you hear is sound that goes outwards from the loudspeaker, fills up the room, bounces around and then gets to you. Only about 1% or less of what you hear actually comes directly to you from the loudspeaker…
  • rooms have early reflections that mess up the tone colour and the imaging of the loudspeakers
  • rooms have room modes that make the bass response extremely uneven, and very different from place to place in the room
  • rooms have reverberation that, generally, makes some frequency bands sound louder because they last longer in time

So, to borrow a phrase from South Park’s Mr. Mackey, “rooms are bad, m’kay?

For this posting, we’re going to focus only on the third issue there: that of “room modes” and a couple of ways to deal with them. To begin with, let’s talk about what a room mode is.

The short version

The PowerPoint-single-slide-of-bullet-points version of an explanation of room compensation is as follows:

  • A room mode is a resonant frequency where the room “sings along” with the sound of the loudspeaker, making that pitch (or note) sound louder than others.
  • This resonance can be measured using a microphone
  • To reduce the effect of this problem, the loudspeaker can either
    • reduce the amount of energy it emits at that particular frequency
    • actively absorb energy at that frequency
  • This means that one detrimental aspect of the room’s acoustical behaviour on the sound of the loudspeaker will be reduced


That’s it. However, of course, the real story is a little more nuanced (or maybe just more complicated) than that. So, if you’re interested in knowing a little more, read on!


Resonance

If you put a kid on a swing and push him (not too hard… we don’t want anyone to get hurt here…) and stand back, you’ll watch him swing back and forth, decreasing a little in distance from the resting position each time, until eventually, he’ll come to a stop. Now, do it again, and pay attention to his movement. He moves forwards, away from the resting position until he reaches a high point, then stops, comes backwards past the resting position to a high point, stops, and then moves forwards again. We’ll call that total return trip from going forwards at the resting position to being back again, going forwards at the resting position, one cycle. The number of times the kid does this for each period of time (let’s say, in this case, each minute) is called the frequency – how frequently he’s repeating the motion. The maximum distance he moves from the resting position (to the highest point in the cycle) is called the amplitude.

Now, if you pay really close attention to the movement of the kid on the swing, you might notice that, even though the amplitude of the cycle decreases over time, the frequency doesn’t change.

Another example of this kind of motion is shown in the video in this posting. However, that video is not for the faint-of-heart. Watch it at your own risk…

Okay, if you watched that video and you’re still awake, let’s move on.

There are a couple of important concepts to glean from this discussion so far.

  • If you have a system that can resonate (like a spring and a mass, or a kid on a swing), it will “want to” resonate at a fundamental frequency.
  • You can trigger that system to resonate at its fundamental frequency by injecting energy into the system (like lifting the mass, or pushing the kid)

Another example of a system that “wants” to resonate is a string that’s fixed on both ends – like a guitar string. It has a fundamental frequency that is determined by the string’s mass and tension. The cool thing about a string is that it also resonates at multiples of that fundamental frequency (better known as harmonics or overtones – which almost mean the same thing, but not quite – but the difference is irrelevant here). So, if you have a guitar string that’s tuned to 100 Hz (an abbreviation for “Hertz” which is the word we use to mean “cycles per second”) then it will also resonate at harmonics with frequencies of 200 Hz, 300 Hz, 400 Hz, and so on. If you inject energy into the string (by plucking it with your finger, for example), then the string’s total vibration will include resonances at all those frequencies, on up to ∞ Hz (in theory… not in practice…). You’ll have a resonance at each individual harmonic, each with its own amplitude (how much the string is vibrating or moving away from its resting position – the higher the amplitude, the louder it is) and the total sum of all of these results in the shape (and sound) of the string.

To see this in action, check out this video.

At this point, you’re probably wondering “what does this have to do with my room?” We’re getting there… I promise.

One last example of a system that resonates is the air in a pipe (like an organ pipe, for example). If you could shrink yourself down to the size of a molecule and get inside an organ pipe, you’d see that you’re looking down a long tube that’s capped at both ends (we won’t talk about the other kind of pipe that’s open on one end… let’s pretend those don’t exist…). If you face one end of the pipe and push the air molecule next to you towards it, it will push the one in front of it, which will push the one in front of it, and so on, until the shoving match ends at the cap at the end of the pipe. (See this page for a good animation of the story so far…) That last molecule can’t push the “wall” so it bounces back, which winds up in a return shoving match (or pressure wave…) that will eventually push against you, and you’ll push the molecule behind you, which keeps repeating until the wavefront gets to the cap at the opposite end of the pipe, which reflects, and sends wavefront back to you again.

Now, what happens if, while all of that is happening, you are pushing repeatedly? Every time the wave bounces back at you, you push it again in the same direction that the particles want to move in (this is exactly the same as pushing a kid on a swing at exactly the right time to make him swing higher and higher – you time the push so that he’s moving in the same direction as you’re pushing).

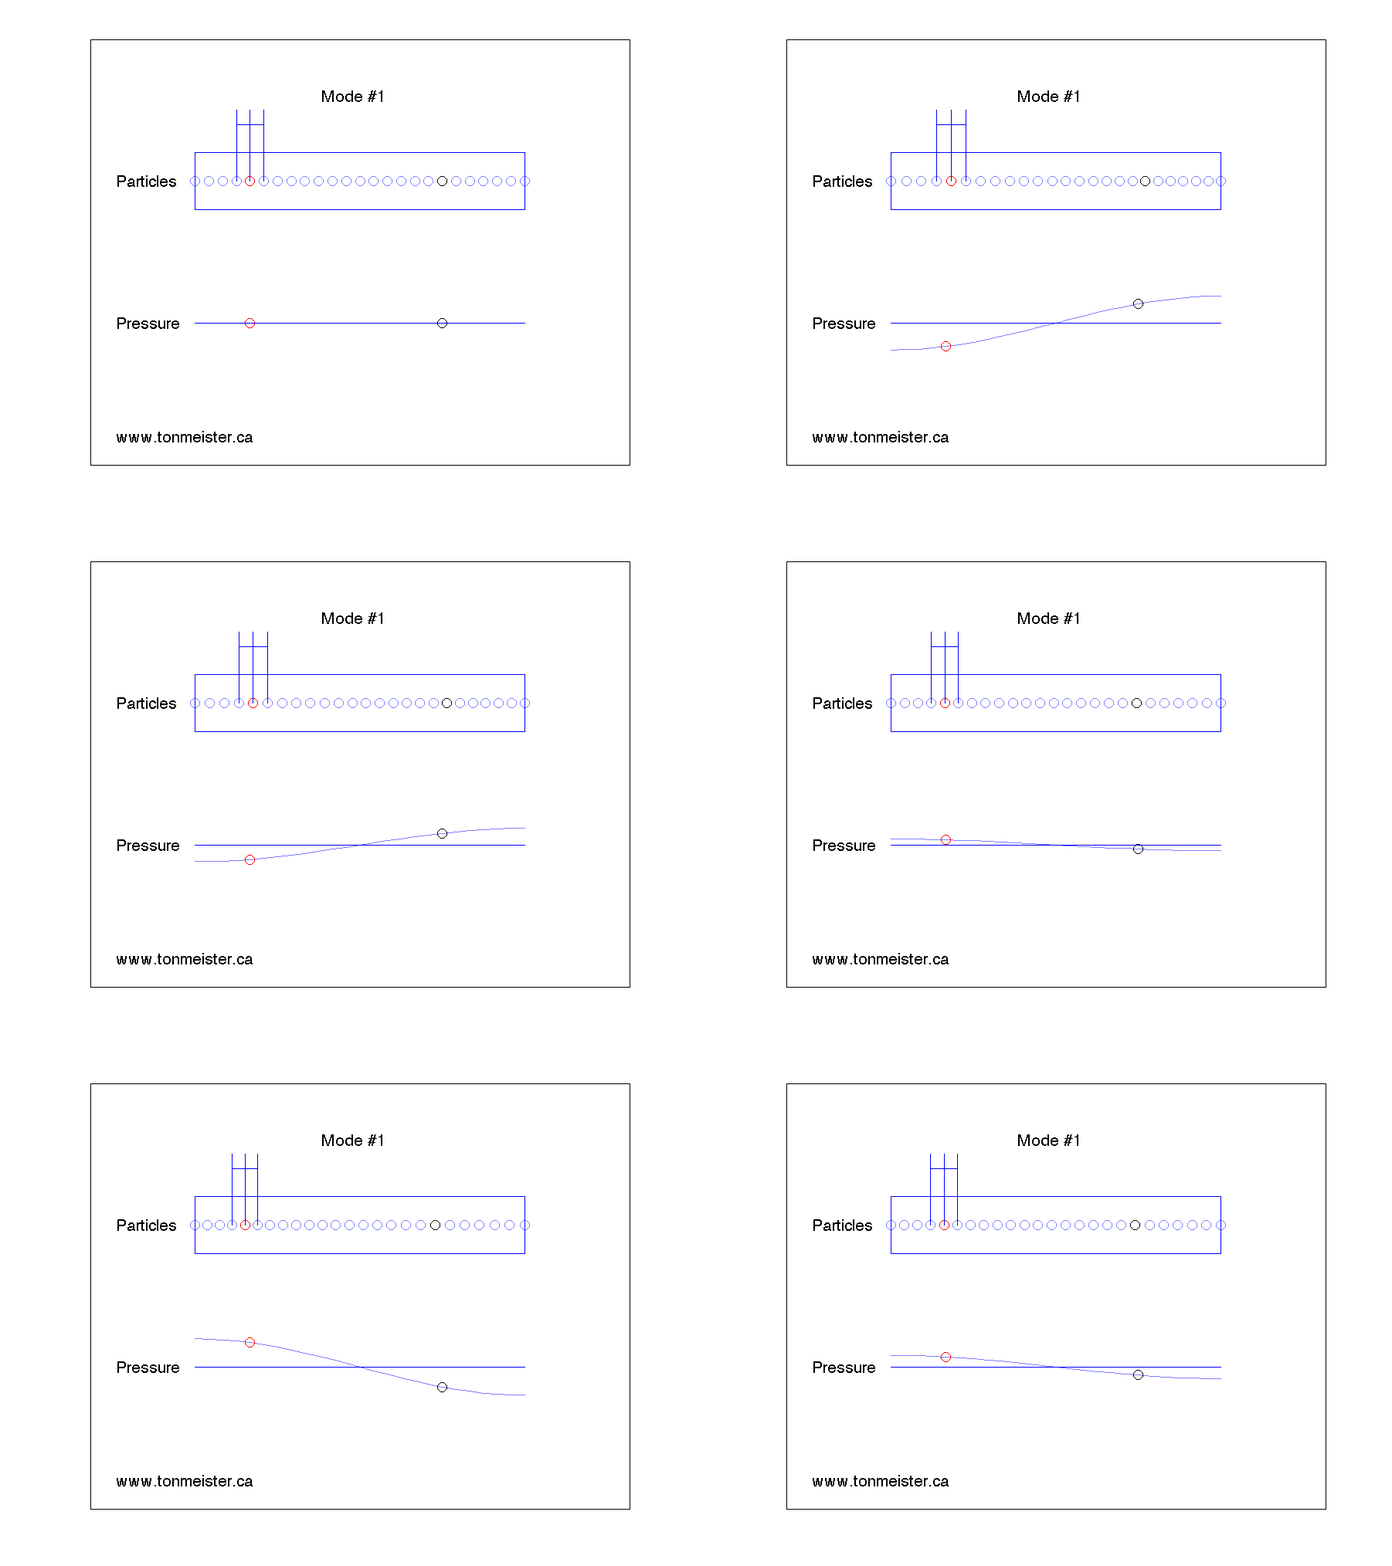
Take a look at the top part of the animation below.

Temp Caption

Let’s say that you’re the red molecule and you’re in a pipe. You push and pull the two adjacent particles (one in front, one behind) exactly in sync with the wave that’s reflecting off the two ends of the pipe, and you’re helping to inject energy into the fundamental resonance of the air column inside the pipe. The result is something called a “standing wave”. it’s called this because it looks like the wave is “standing still” and just changing in instantaneous amplitude over time, but the reality is that this is just an illusion. What is actually happening is that the right-going wave is aligned with the left-going wave to perfectly cancel each other out at all times in the middle of the pipe, and to result in big changes in pressure at the ends of the pipe. Check out the third animation on this page for a good explanation of this summing or “superposition” of waves resulting in a standing wave.

Just like a string, a pipe will also resonate at harmonics of the fundamental, in multiples of the frequency of the lowest resonance. So, if the pipe resonates at 150 Hz, then you will also have resonances at 300 Hz, 450 Hz, and so on… I’ll show some animations with examples of these later in the posting.

Room Modes

The nice thing (at least it’s nice in that it helps our understanding – it’s not actually nice in real life…) is that a room behaves just like a very big, very wide, organ pipe. So, for example, when I sit in a listening room that is 5 m wide by 6 m long, some of the resonances that I hear “singing along” with every sound source in the room are exactly the same frequencies as the ones that would come out of organ pipes 5 m long and 6 m long.

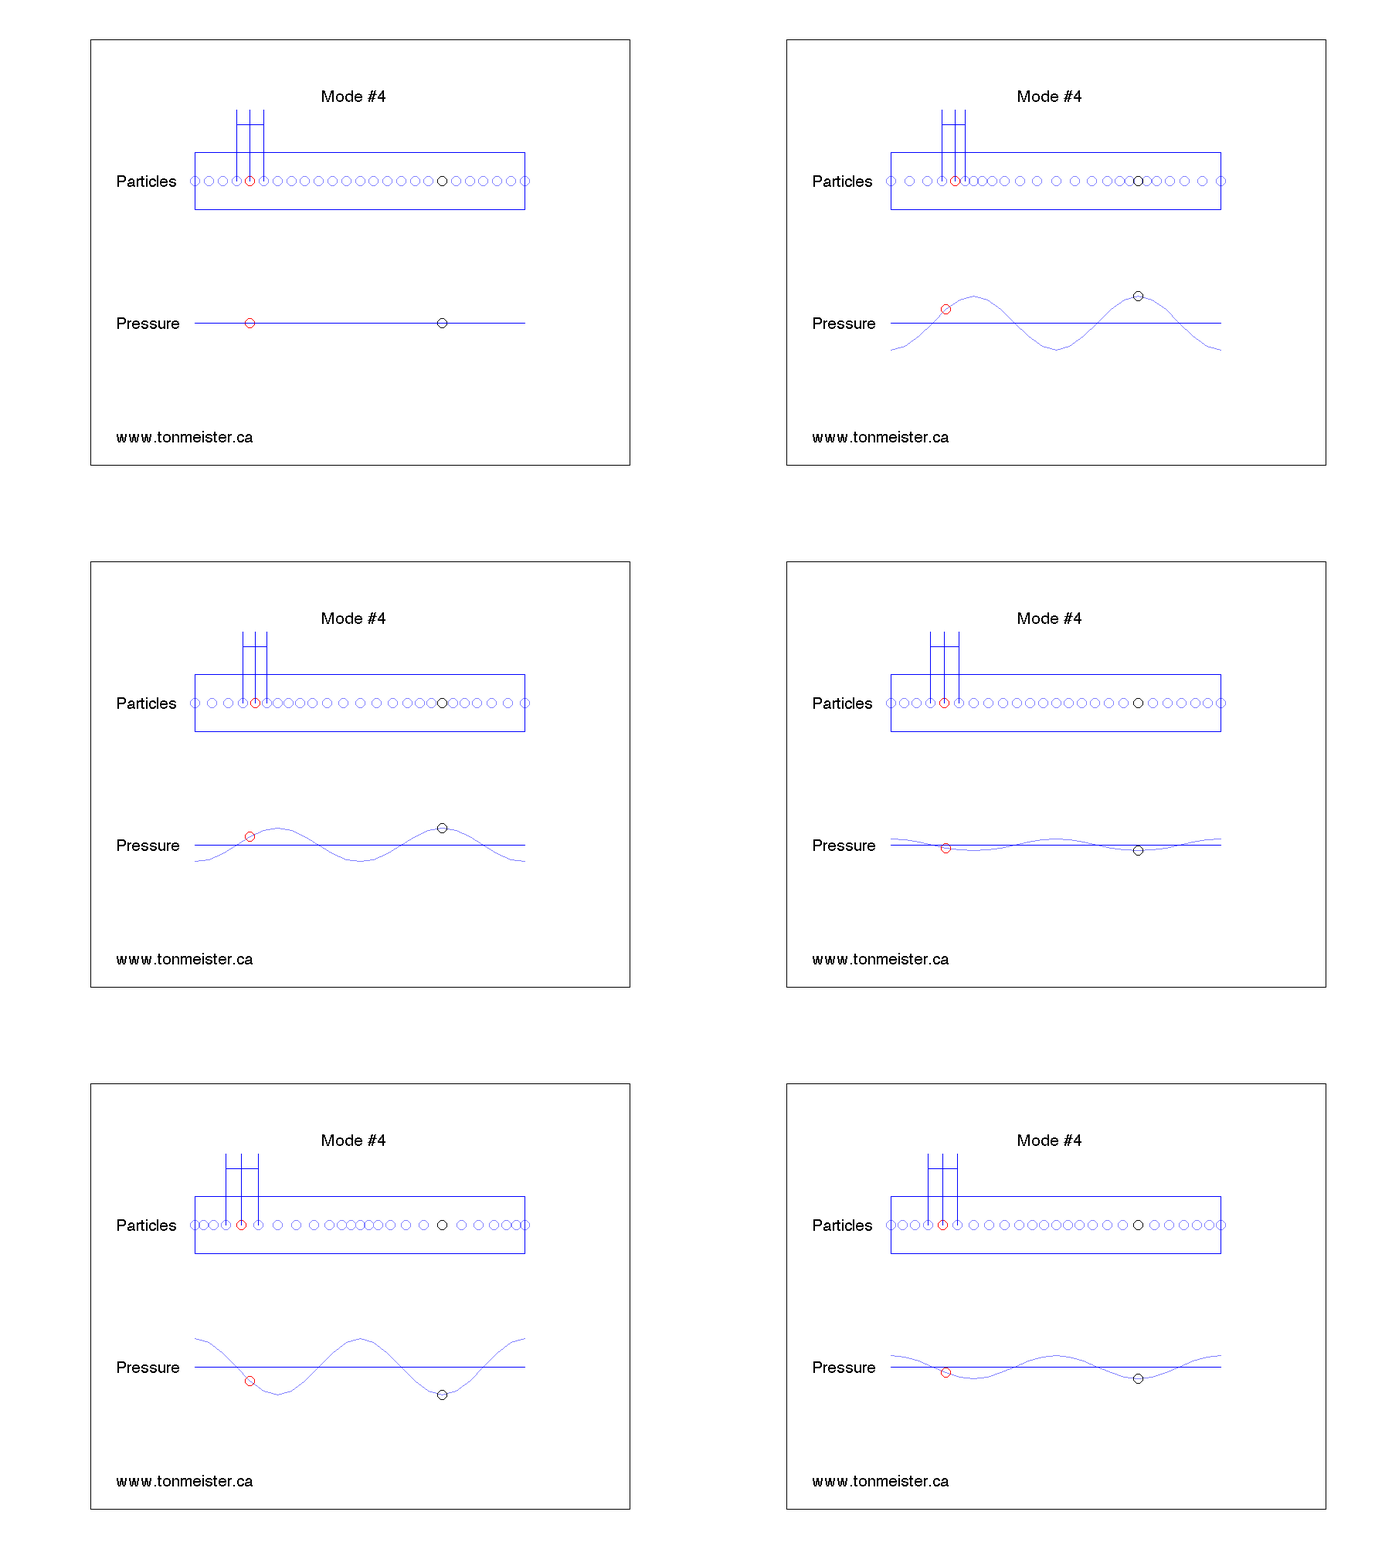
Take a look at that animation above once again. You can think of the red dot as the loudspeaker, pushing and pulling the adjacent air particles in time. You sit at the listening position at the black dot – the adjacent air particles push and pull your eardrum in and out of your head. The pressure of the sound wave (the only thing we’re going to worry about in this posting) can be thought of as a measure of how close two adjacent air particles are (shown by the three vertical lines in the top part, and represented by the entire bottom part of the animation).

So, as the loudspeaker woofer (for example) moves in and out of the enclosure on a kick drum hit, it injects energy into the room at many different frequencies. If the frequency of the resonance in the room is one of the frequencies in the woofer’s signal, then that note will sound much louder than the other notes, making for a very uneven bass. This is because the room “wants” to resonate (or “sing along”) at that particular frequency, so a little energy coming into it will give a large result (just like a series of small, but well-timed, pushes of a kid on a swing can build up over time to result in the kid moving back and forth much more than you’re pushing).

This will happen not only at the fundamental frequency of the resonance, but its harmonics. The second harmonic is shown below.

animation_mode_02

The third harmonic looks like the animation below.

animation_mode_03

And the fourth harmonic looks like the animation below.

animation_mode_04

We won’t go any higher than this.

There are some things to notice in these animations.

  1. The air particles at the walls on either end of the room experience the maximum pressure change. This is because one of the particles cannot push the wall, so it receives the full effect of the pressure.
  2. There are places in the room where the pressure does not change over time. For example, in the case of Mode #1 in the first animation, the point at the exact middle of the room doesn’t have a change in pressure. This doesn’t mean that the air particles are not moving – they are. However, the ones in the middle of the room are staying the same distance from each other – so the pressure doesn’t change over time.

If you are sitting at a point in the room where there is no change in pressure caused by the mode (say, for example, you’re the black dot in Mode #2, above), then you will not be able to hear the room mode. It’s still happening around you – but at your exact position, since there is no change in pressure over time, it doesn’t exist. However, this doesn’t mean that you won’t hear anything at that particular frequency – you will – it’s just that the sound you hear (from the loudspeaker) doesn’t have the room mode singing along with it at your location.

Similarly, if the loudspeaker is placed at a location where there is no change in pressure when the room mode is ringing (for example, the location of the red circle in Mode #3), then the loudspeaker will not trigger this mode to ring. Energy will come out of the loudspeaker at that frequency, and you’ll be able to hear it – but the room mode will not “sing along” with the signal, since the loudspeaker can’t inject energy into it. (Note that this is statement is based on at least two assumptions: (1) that the loudspeaker is a pressure source, and (2) that it is infinitely small. At least one of these assumptions is incorrect.)

This means that, looking at the four animations above, and assuming that the red dot is the loudspeaker and the black dot is the listener:

  • We need to fix Mode #1, since the loudspeaker and the listener are “coupled” to it (meaning that they are not sitting on a point where there is no pressure change in the mode).
  • We do not need to fix Mode #2 since, although the loudspeaker is triggering the mode to ring, the listener cannot hear it. (However, if the loudspeaker was placed somewhere else, this mode could be a problem.)
  • We do not need to fix Mode #3 since the loudspeaker cannot trigger the mode, so no one hears it (although the mode will occur for other sound sources in the room).  (Also, if the listening position was placed somewhere else, this mode could be a problem.)
  • We need to fix Mode #4.
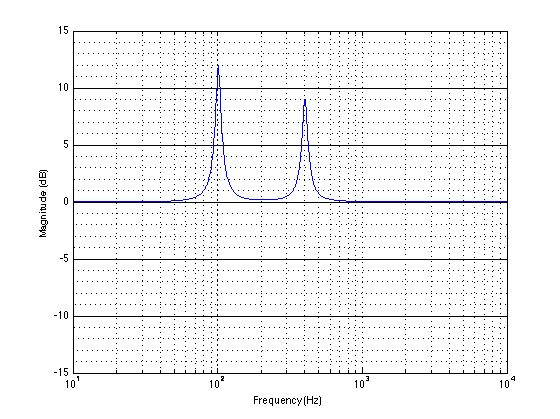
A simulated example of the total result of two modes, the fundamental at 100 Hz, and the 4th harmonic at 400 Hz (see the above text to explain why 200 Hz and 300 Hz are missing...)
Figure 5: A simulated, over-simplified example of the total effect on the magnitude response of two modes, the fundamental at 100 Hz, and the 4th harmonic at 400 Hz (see the above text to explain why 200 Hz and 300 Hz are missing…)

How can we fix this?

As I said in the PowerPoint version above, we have two basic strategies for dealing with room modes.

The first is a “symptom attenuation” approach: the room mode makes some frequencies louder than others, so we’ll just reduce the level of those frequencies by the same amount. If the room boosts 100 Hz by 6 dB, then we’ll put a dip of -6 dB at 100 Hz in the signal sent to the loudspeaker. This doesn’t actually correct the problem – it just covers it up. It’s a bit like taking a pain killer because you’ve broken your leg. You are no longer in pain, but the problem still exists… The trick here is to measure the response of the loudspeaker at the listening position (this is easy) and find out which frequencies appear to be boosted by the room. We then make an equalisation which is that same response turned “upside down” so a peak in the measured response becomes a dip in the loudspeaker’s processing.

As I said, this covers up the problem but it doesn’t solve it. The thing to remember is that a room mode appears to be louder because the room moves the energy in time. For example, if you pluck a guitar string, you “activate it” for a very short period of time. The resonance of the string takes that energy and extends it in time so you hear a note that goes on for seconds after the pluck. A room mode does the same thing – it “rings” in time, smearing the energy coming out of your loudspeakers (say, a kick drum hit) and extending it like a guitar string ringing. If you send less energy out of the loudspeaker at the same frequency of the room mode, then the total result at the listening position will be quieter, but it’s still ringing in time. (So, instead of plucking the guitar string and then stopping it, we’re just plucking with less force.)

The second method is a little more complicated, but works better. Since we have control of the loudspeaker, what we can do is to send the sound we want out of it – but we’ll add an extra signal that cancels the room mode by working against it. If we go back to the original description where we were a little air particle in a pipe, we send the signal out, and when it comes back, reflected off the cap, we’ll send a signal out of the loudspeaker that “sucks it back in”. This way, the loudspeaker acts as an active absorber. (This is a little like the way a person on a trampoline can stop jumping by using his/her legs to absorb the push-back from the springs. See this video at 0:53, for example.)

The great thing is that, if you’re smart and a little lucky, both of these approaches are the same thing. If we consider the room mode to have the same characteristics as a “minimum phase” peaking filter (which, in isolation, it does), then, if we can measure it correctly, we can implement its exact reciprocal. This means that the magnitude response of the filter we insert into the loudspeaker’s processing will be the exact opposite of the room’s response. In addition to this, the phase response of the filter is, at any frequency, opposite in polarity to the phase response of the room mode (in isolation). This means that both approaches are rolled into one solution.

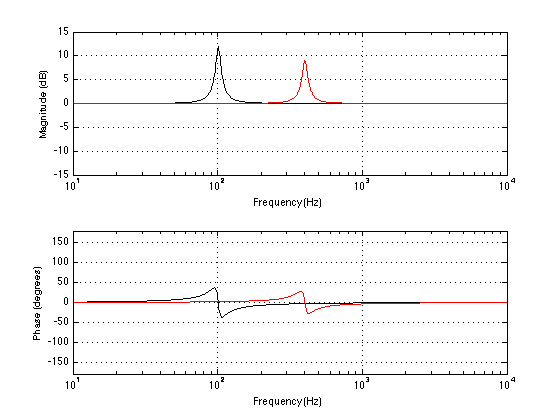
The same two modes shown in the previous figure, decomposed into the two individual resonances.
Figure 6: The same two modes shown in Figure 5, decomposed into the two individual resonances.


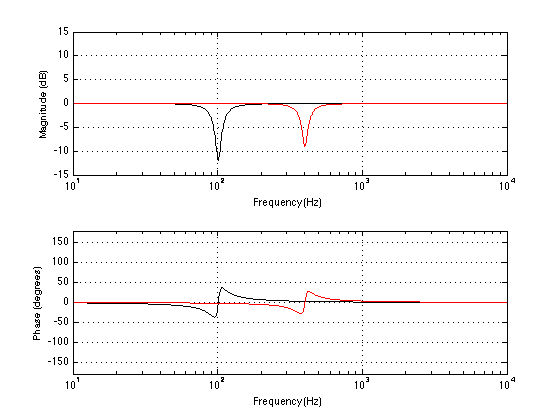
The correction filter we would need to cancel the effects of the two modes shown in the previous figure. Note that the phase responses are polarity-inverted copies of the modes' phase responses.
Figure 7: The correction filter we would need to cancel the effects of the two modes shown in Figure 6. Note that the phase responses are polarity-inverted copies of the modes’ phase responses. If we take the signals shown in Figure 6 and process them with a filter with the characteristics shown in Figure 7, the result would be a perfectly flat signal, as if nothing had happened to it.


Of course, this is very theoretical. However, in practice the concept holds true enough that it results in a noticeable improvement in the sound of a loudspeaker in the listening position, assuming that you are careful about the measurements you make around that position. If you choose to make a room correction filter that applies to the whole room, and not just one listening position, then you should measure the room in many different and varied locations. This will give you a “general” compensation that is better, on average, for everyone in the room – although it might make one specific location (like, say, the sweet spot) worse. If, instead, you just measure one location by placing the microphone in a tight area around the sweet spot, for example, then the compensation filter will be optimised for that location, but it will probably make the rest of the room worse as a result.

Active Room Compensation gives you this option to customise the room compensation filters as they best suit your needs. If you’re the kind of person with one chair and no friends, then you measure around that chair and you never leave it while you’re listening. If you’re the kind of person who has lots of friends, or who moves around while you listen, then you create a compensation filter that fixes the entire room, on average.

Of course, in a perfect world, you would be able to make both of these measurements in advance and save each one as a preset – then you would be able to select the one that best suits the situation when the time arises… Or, you could combine them and build a filter that corrects the room, with emphasis on the sweet spot…

P.S. As I mentioned briefly in this posting, Active Room Compensation has one additional feature – multichannel processing. That will be explained later in Part 2.

B&O Play H8 headphone reviews

beoplay_h8

I was part of the development team, and one of the two persons who decided on the final sound design (aka tonal balance) of the B&O Play H8 headphones. So, I’m happy to share some of the blame for some of the comments (at least on the sound quality) from the reviews.

Because they were sound designed primarily for portable use, the H8’s have a intentional emphasis on the lower frequency band in their tuning. As you can see in the comments about the overall tuning below, this appeals to some, and not to others – and for some, it’s an expectation. This difference in opinion is probably not only attributable to taste in timbral balance, and in musical style, but also in what the reviewer’s “reference” (or at least most-used) headphones are.


CNET review: “As for sound quality, this is an exciting headphone with lots of bass — it definitely goes deep — a fairly warm midrange and good clarity, though it’s a touch hyped in the treble, which comes out more when you listen to this as a wired headphone (however, most of that treble edginess is eliminated when you turn the noise canceling on, which dulls things up a touch). And yes, it does sound better as a wired headphone, but that’s not surprising considering you tend to give up some sound quality by going the Bluetooth route.”

Pocket-lint review: “… crisp highs and clapping mids with clarity. The balance may be bass-heavy, but the full mix of any given track still pushes through with gusto.”

Headfonia review: “Tuning is clearly bass focused and while it’s no audiophile kind of unit, the tuning is very enjoyable and fun.”

Huffington Post review: “So how do they sound? Well extremely good…  If we had a single niggle it’s that they can sound a little overwhelmed by the lower end and middle ranges, with the higher clearer notes being sometimes drowned out. It’s not that the sound is muffled, more that the treble just feels quieter than perhaps it could.”

Lyd & Billede review: “Lydmæssigt har H8 en forholdsvis neutral lyd, der hælder mod det varme. Bassen er solid. Ikke overvældende som i club-hovedtelefoner (de er trods alt møntet på et pænt og veletableret publikum), men der er bund nok til, at det rocker.”

Qubuz review: “It has an expansive sound and does not hold back in the low- and mid-ranges.”

Mashable review: “The H8 have a very flat sound profile, which is even more noticeable with active noise-cancellation turned on. A flat sound profile means songs across a variety of genres sound neutral and clean and the headphone maker didn’t tune them to emphasize certain frequencies, like boosting the highs (trebles) or the lows (bass) too much.”


B&O Tech: The Heat of the Moment

#39 in a series of articles about the technology behind Bang & Olufsen loudspeakers


“If you saw a heat wave, would you wave back?”

– Steven Wright


Part 1: The Myth(?)

Once upon a time, back in the “olden days” (as my kids call them), before I worked at Bang & Olufsen, I did a Master’s degree at McGill University as a tonmeister (hence the domain name…). In practice, this means that I was trained to be someone who knew as much about things like room acoustics, microphone techniques, recording practices and electronics as I did about music. (Of course, if I knew nothing about music, then this equation falls apart…) In practice, what it meant was that I spent a LOT of time in recording studios (literally more time than I remember) doing recordings or just listening to them.

Now, let’s think about the design of a typical “good” recording studio control room. Usually, you have a mixing console in the middle of the room, and at least one pair of small studio monitor loudspeakers sitting on the meter bridge. Also, up on the front wall, there’s a large pair of “soffit mounted” loudspeakers built into it. Figure 1, below, shows an example of this.


Figure 1. A typical recording studio. Notice that there are a pair of small loudspeakers (usually called "nearfield monitors") sitting above the mixing console, and a pair of large "soffit-mounted" loudspeakers on the walls.
Figure 1. A typical recording studio. Notice that there are a pair of small loudspeakers (usually called “nearfield monitors”) sitting above the mixing console, and a pair of large “soffit-mounted” loudspeakers on the walls.


One story I heard back in the “olden days” was that, if you’re building a recording studio, you should always keep the amplifiers for your big soffit-mounted loudspeakers away from (or at least above) the loudspeakers themselves. You should never NEVER put the amps directly under the loudspeakers. The story went that the reason for this was that hot air rising from the amplifiers would waft past the tweeters, modulating (changing) the speed of sound of the air between the tweeters and the listening position. And, since this modulation was random, then this heat would sometimes cause the right channel to arrive at the listening position earlier than the left, sometimes later. The result (according to the story) would be a constant shifting of the phantom image, moving left and right instead of staying exactly in the middle where it should be. The analogy/metaphor/explanation was that the image location would “shimmer” in the same way that there appears to be water on hot asphalt in the distance on a summer day, or the way you can see heat rising from a hot surface like a barbecue.


Fast-forward about 25 years, and I’m sitting in a meeting at B&O, discussing mechanical design options for high-end loudspeakers. Someone in the room says “one possibility is to put the radiators for the amplifiers on the face of the loudspeaker, just under the midranges and tweeters” and I say “you can’t do that – you’ll screw up the phantom imaging”. Heads turn to look at me, the expressions on the faces obviously say “what on earth are you talking about?” So, I tell the story that I heard back in the olden days…

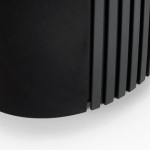
Quick sidebar: if you don’t already know, almost all Bang & Olufsen loudspeakers are active loudspeakers, which means that the amplifiers and power supply are inside the loudspeaker enclosure. Amplifiers and power supplies are never 100% efficient. In addition to this, because we use DSP to control the loudspeaker, we can push our loudspeaker drivers to their limits without melting their voice coils – this also results in a lot of heat. All of this means that our loudspeakers need a lot of thought into their thermal design – basically, we need to make sure that the heat can get out, which is why we need radiators like the one shown in the photo on the right (which shows the bottom of the back of a BeoLab 20. The vertical stripes are a metal radiator attached to the electronics inside.). We now return you to your regularly scheduled story…

Some of the engineers in the room say “that’s crazy” – and others (the ones I like) say “let’s find out…” So, using the modern tools for finding-things-out, we started by typing things like “loudspeaker amplifier heat phantom image” into Google. This resulted in no information – or at least no useful information. So this meant that we had to do an experiment.

Part 2: The pilot experiment

Okay, so the question is: does heat rising in front of a tweeter have an effect on the sound that it radiates? And, if so, what is/are the effect(s) and what kind of magnitude of effect are we talking about? The easiest way to find this out is to exaggerate the effect. So, we got a tweeter and a hot plate (which lives in the acoustic department exclusively for warming risalamande at the yearly Julefrokost (the ubiquitous Danish “Christmas lunch” literally translated, although it can happen as early as November, it rarely starts at lunchtime, and typically extends well into the evening…) and we set them up as shown in Figure 2.


Figure 2: The setup for the first experiment showing the tweeter and the hot plate on the Crane in the Cube.
Figure 2: The setup for the first experiment showing the tweeter and the hot plate on the Crane in the Cube. The BeoLab 6000 in the background was not part of the experiment.


We put a microphone in front of the tweeter at a distance far enough away that the microphone wasn’t getting heated by the hot plate (about a metre or so…), and we sent a high frequency tone (20 kHz) to the tweeter from a sine wave generator. Then we simply sent the original signal and the output of the microphone to an oscilloscope so that we could look at them in real time.


Figure 3. The original signal and the output of the tweeter at the microphone location when the hot plate was turned off.
Figure 3. The original signal and the output of the tweeter at the microphone location when the hot plate was turned off. (Note: Exposure time: 30 seconds)


Figure 3 shows the result when the hot plate was turned off. The original signal and the microphone signal are both clean, as you can see there.


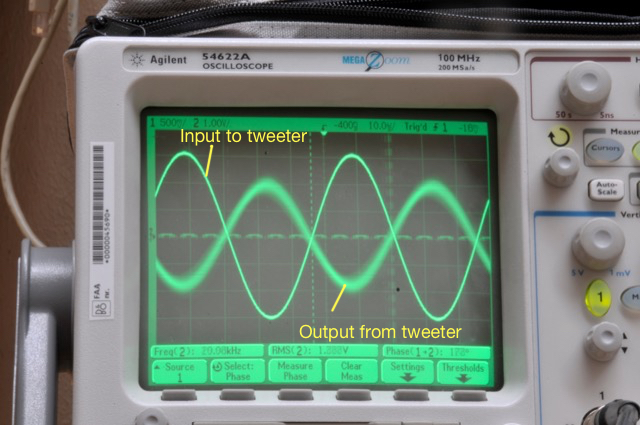
Figure 4. The original signal and the output of the tweeter at the microphone location when the hot plate was set to "medium".
Figure 4. The original signal and the output of the tweeter at the microphone location when the hot plate was set to “medium”. (Note: Exposure time: 30 seconds)


Figure 4 shows the same thing, but the hot plate is now set to “medium”. As you can see there, the output from the tweeter is much more “blurry”. This is because it is moving on the screen over the 30 seconds of the photo exposure. Note that it is moving in both the X-axis (meaning the level was changing over time) and the Y-axis (meaning that the time of travel from the loudspeaker to the microphone was changing over time).


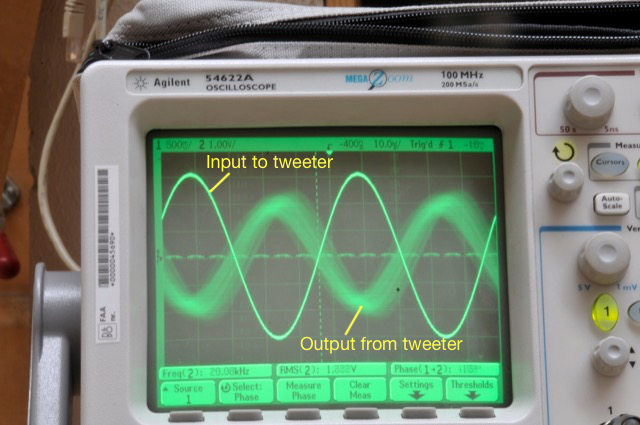
Figure 5. The original signal and the output of the tweeter at the microphone location when the hot plate was at maximum.
Figure 5. The original signal and the output of the tweeter at the microphone location when the hot plate was at maximum. (Note: Exposure time: 30 seconds)


Figure 5 shows the same thing, but the hot plate is now set to “maximum” (hot enough to boil water or to burn risalamande). As you can see there, the output from the tweeter is even more “blurry”for the same reason. It’s also fairly easy to see in that photo that the output from the tweeter is modulating in both axes.

One thing to be clear of here is that we are looking at the effect of modulating the temperature of the air in front of the tweeter. We’re not changing the temperature of the tweeter itself (at least, not with the hot plate – the tweeter heats itself, but that’s another story) or the microphone.


Part 3: The “real” experiment

Okay, so we had some proof that the story that I heard back in the recording studio might be true. At the very least, we found out that it would be easy to measure the effect of heat rising in front of a tweeter. Now we had to get a little more useful data by analysing the signal from the microphone a little better. Looking at the signal on an oscilloscope is good for intuition, but it’s hard to graph the results.

So, this time we changed the setup a little. We used a little studio monitor loudspeaker (with some minor alterations – we taped over the ports to ensure that we weren’t modulating the air around the loudspeaker as a result of airflow through the port, just in case… for the lower frequencies… Since we were only playing sine tones and we’re not really interested in the absolute magnitude response of the loudspeaker, the lack of a port didn’t matter too much to us…) and we recorded the microphone output instead of just looking at the signal on a ‘scope. (We were also careful not to move during the recordings, partly to reduce background noise, but also to avoid creating air currents … just in case…) The total setup (although it’s still pretty simple) is shown in Figure 6.


Figure 6. A small studio monitor with sealed ports and the hotplate with a microphone.
Figure 6. A small studio monitor with sealed ports and the hotplate with a microphone. The gray panels are an acoustically absorptive foam called Basotect. We use that a lot inside loudspeaker cabinets, so we have plenty lying around…

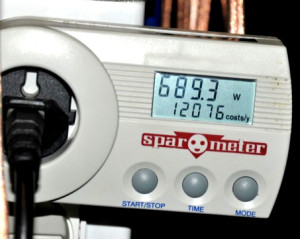
We also tried measuring the air temperature in front of the loudspeaker, but this was difficult because it was fluctuating so much and so rapidly. So, instead, we put a power meter on the mains feed to the hot plate to get a better idea of how much constant power we were using.

Figure 7. The power monitor on the hotplate.


The results

Our analysis was to see how much the phase and the magnitude were changing over time with different frequencies and different settings of the hot plate temperature. This was done by analysing the recordings of the microphone signal for a 30-second period. The results turned out to be different for different frequencies – and surprisingly large in some cases…

Some details for the geeks-amongst-you:

  • The recordings were done with a 192 kHz sampling rate so that we had plenty of bandwidth to play with for the next step.
  • We took each 30-second recording and band-limited it to a frequency band 2 octaves wide using second-order high pass and low pass filters, with the tone being the centre frequency (geometrically). (In other words, for example, the 16 kHz recording was band-limited from 8 kHz to 32 kHz). The reason for this was to reduce the influence of background noise in the recordings for the level analysis.
  • The phase analysis was done based on the output of a single FFT bin which provided its own noise immunity.
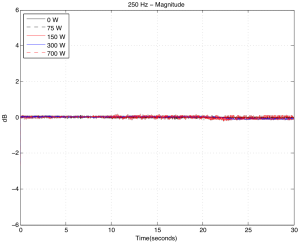
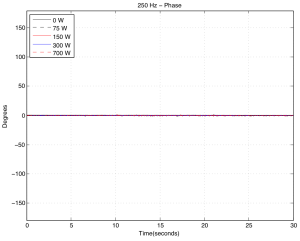
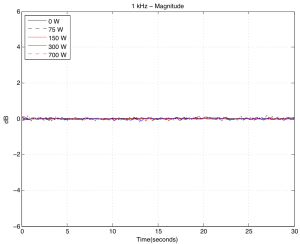
  • The recordings were done at 5 power consumption settings of the hot plate: 0 W, 75 W, 150 W, 300 W and 700 W. These roughly corresponded to air temperatures in front of the tweeter 25º C, 28º C, 30º C, 34º C, and 44º C. I say “roughly” because the air temperature in front of the tweeter was varying quickly and widely, so this is just a ballpark measurement to get a rough idea of the effect of the hot plate. Due to this uncertainty, the plots below are relative to the power consumption of the hot plate rather than the air temperature.


Change in magnitude of the signal at the microphone over time for different hot plate temperatures. 250 Hz tone.
Figure 8a: Change in magnitude of the signal at the microphone over time for different hot plate temperatures. 250 Hz tone.


Change in phase of the signal at the microphone over time for different hot plate temperatures. 250 Hz tone.
Figure 8b: Change in phase of the signal at the microphone over time for different hot plate temperatures. 250 Hz tone.

As you can see above in Figures 8a and 8b, there was almost no effect on a 250 Hz tone, even when we pushed the hot plate up to 700 Watts. There is a very small change in magnitude, however this might be caused by background noise.

Change in magnitude of the signal at the microphone over time for different hot plate temperatures. 1 kHz tone.
Figure 9a: Change in magnitude of the signal at the microphone over time for different hot plate temperatures. 1 kHz tone.
Change in phase of the signal at the microphone over time for different hot plate temperatures. 1 kHz tone.
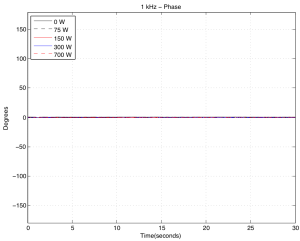
Figure 9b: Change in phase of the signal at the microphone over time for different hot plate temperatures. 1 kHz tone.

As you can see above in Figures 9a and 9b, at 1 kHz the effect is not getting much more noticeable.

Change in magnitude of the signal at the microphone over time for different hot plate temperatures. 4 kHz tone.
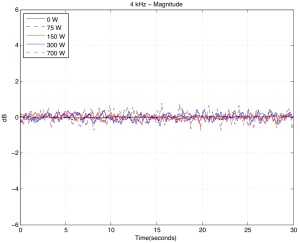
Figure 10a: Change in magnitude of the signal at the microphone over time for different hot plate temperatures. 4 kHz tone.
Change in phase of the signal at the microphone over time for different hot plate temperatures. 4 kHz tone.
Figure 10b: Change in phase of the signal at the microphone over time for different hot plate temperatures. 4 kHz tone.

Figures 10a and 10b, show the modulation for 4 kHz. Now we’re starting to see some effects…

Change in magnitude of the signal at the microphone over time for different hot plate temperatures. 16 kHz tone.
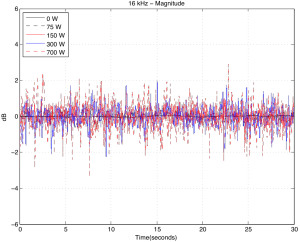
Figure 11a: Change in magnitude of the signal at the microphone over time for different hot plate temperatures. 16 kHz tone.


Change in phase of the signal at the microphone over time for different hot plate temperatures. 16 kHz tone.
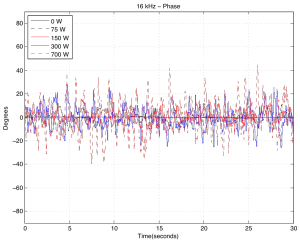
Figure 11b: Change in phase of the signal at the microphone over time for different hot plate temperatures. 16 kHz tone.

Figures 11a and 11b, show the modulation for 16 kHz . You can see there that, in a worst-case scenario, we’re getting magnitude changes on the order of +/- 3 dB or so (which would mean, in a stereo system, a worst-case difference between the two loudspeakers’ signals of about 6 dB), and phase changes on the order of about +/- 40 degrees (so a worst-case difference between the two loudspeakers’ signals of about 80 degrees).

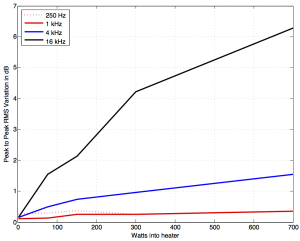
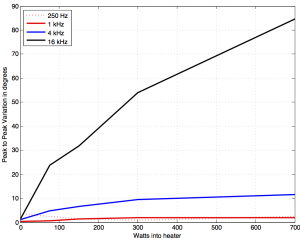
If we then look at the peak-to-peak variation in the above graphs and plot that as a function of hot plate power consumption for the different frequencies, we get the results shown in Figures 12 and 13.

Total result of the relationship between the peak-to-peak change in magnitude vs hot plate power consumption for different frequencies.
Figure 12: Total result of the relationship between the peak-to-peak change in magnitude vs hot plate power consumption for different frequencies.


Total result of the relationship between the peak-to-peak change in phase vs hot plate power consumption for different frequencies.
Figure 13: Total result of the relationship between the peak-to-peak change in phase vs hot plate power consumption for different frequencies.


So, the conclusion from the measurements was that the effect was considerable at high frequencies and high temperatures, but might be significant at lower values as well… the question was to ask “what is significant?”

Luckily, for the phase modulation part of the question, we had a partial answer from an experiment that we did a long time ago. In a paper called “Audibility of Phase Response Differences in a Stereo Playback System. Part 2: Narrow-Band Stimuli in Headphones and Loudspeakers” (Presented at the 125th AES Convention,  Paper Number ) , Sylvain Choisel and I reported that subjects were able to detect phase response differences in loudspeakers with a threshold of approximately 50 degrees phase difference, regardless of frequency – although we only tested up to 8 kHz… Apart from the 16 kHz measurements in this experiment, none of the frequencies we measured came close to a worst-case difference of 50 degrees – so we’re probably safe on that one. (Although geeks might be interested to see the below for a little more discussion about this issue looking at it from a perspective of time instead of phase.)

The magnitude response differences may be a similar story. Many studies have been done to find out what differences in level between loudspeakers result in changes in phantom image placement – for example, see this site for a good summary. As can be seen in that graph, a 1.5 dB difference (chosen because that’s the worse-case value for the 1 kHz curve in the plot in Figure 12) in level between the two loudspeakers (measured at the listening position) will result in something like a 15% to 20% shift in phantom image location away from centre (that’s 15% to 20% of the distance to one of the loudspeakers from centre) which will probably be noticeable if you’re paying attention, although it might sound more like a “fuzzy” centre image instead of a moving one… A 6 dB difference (roughly the worst-case value for the 16 kHz curve) can result in an approximately 60%  shift in phantom image location. Note, however that we might be jumping to (incorrect) conclusions here, since some of the data in the plots on that PDF file I linked to above are from listening tests with full-range signals. Whether the values will be valid for narrow-band signals, especially at 16 kHz is unknown…


Part 4: Phase vs. Time

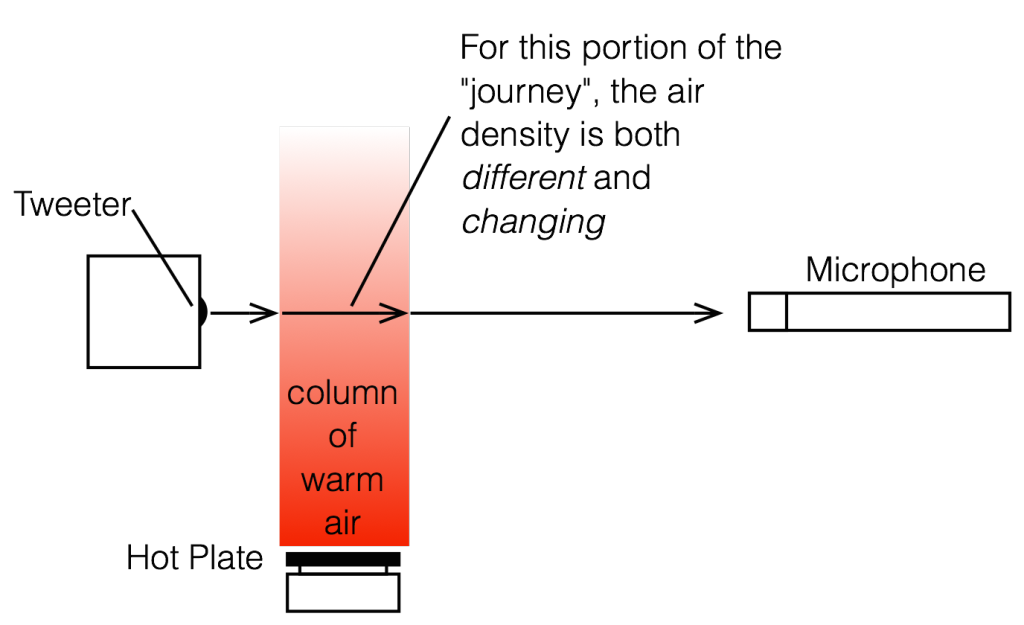
Take a look at the side view of our setup, shown below in Figure 14.


Figure X: Side view with a simplified view of what is happening.
Figure 14: Side view with a simplified view of what is happening.


This is a simplified version of what is happening in the experiment. The sound wave travels outwards from the tweeter, through the air. However, that air has one area where the temperature is significantly different than the rest of the room.

The speed of sound in air can be calculated as follows:

c = 331.3 + (0.6 * T) m/s

where T is the air temperature in degrees Celsius.

So, for example, if the temperature of the air increases by 10ºC, then the speed of sound increases by 6 m/s. If the temperature increases by 50ºC, then the speed of sound increases by 30 m/s. This will change the time of arrival of the sound at the microphone – the hotter the air, the earlier the sound arrives.

However, this change is a change in time. This converts to a change in phase in the sine wave that we were measuring – but you have to remember that a given change in time is equivalent to a change in phase that increases with frequency. For example, a 1 ms delay change is equivalent to a 45º phase shift at 125 Hz, but a 90º phase shift at 250 Hz, a 180º phase shift at 500 Hz, and a 360º phase shift at 1 kHz, and so on…

So, another way to look at this problem is to consider the change in interchannel delay instead of interchannel phase. If you take a look at this site again, you can see that our perception of the phantom image location in a stereo system is very sensitive to changes in interchannel delay. For example, according to Simonsen, an interchannel delay difference of only 200 µs (that’s 0.0002 seconds!) will result in a 30% change in phantom image location. In other words, if you have a “correct” stereo configuration where your loudspeakers are placed +/- 30º from centre front, then delaying one loudspeaker by 200 µs will move the centre phantom image to 9º off-centre (or 30% of the way to the earlier loudspeaker).

Let’s simplify, just to get an idea of what we’re talking about in our experimental results:

Case 1: If the microphone is 3 m from the tweeter and the air temperature is 25º C for all 3 m of travel, then the speed of sound for the entire trip is 346.3000 m/s and the total travel time is therefore 8.6630 ms.

Case 2: If the microphone is 3 m from the tweeter and the air temperature for the first 50 cm of travel is 44º C and the remaining 2.5 m of travel is 25º C, then the speed of sound for the first 50 cm is 357.7 m/s and for the remaining 2.5 m it’s 346.3 m/s. This means you have a total travel time of 8.6170 ms.

The difference between Case 1 and Case 2 is 8.6630 – 8.6170 = 0.046 ms or 46 µs, which, according to Simonsen’s results would correspond to something like a 5% shift in centre image location. Audible? Perhaps, but just barely… However, if you’re checking my math, you’ll note that a 46 µs change in time is equivalent to a 264º change in phase at 16 kHz, which was much larger than the roughly 85º we measured in the analysis above (see Figure 13)… So, my simplified example here seems to be exaggerating the effect, which means that a guess (even a calculated guess) of a 46 µs interchannel latency difference is probably an overestimate…

So, we might be able to conclude that the effect of this with respect to change in time of arrival are also inaudible, according to the data…


Part 5: Why is the level changing over time?

You may notice that I’ve avoided an obvious question throughout the above: “Why does the magnitude of the signal change?” If you look at this site, for example, you’ll see that although there is a change in sound absorption with change in air temperature, it is a very small effect. So, why do we measure such a large change in magnitude (or level) correlated with the temperature of the hot plate? There are two possible explanations for this.

The first was already discussed. At low temperature settings, the variation in level is probably simply an artefact of the background noise. All of these measurements were done in the Cube at B&O – which is normally used for a different kind of measurement which is more immune to background noises. This means that the Cube itself doesn’t have to be quiet, so it isn’t soundproofed from the outside world. Extraneous noises such as wind, rain, or someone walking by pushing a cart in the hallway, are easily audible if you’re sitting in the Cube. However, for the measurements in this experiment, those background noises will infect the results.

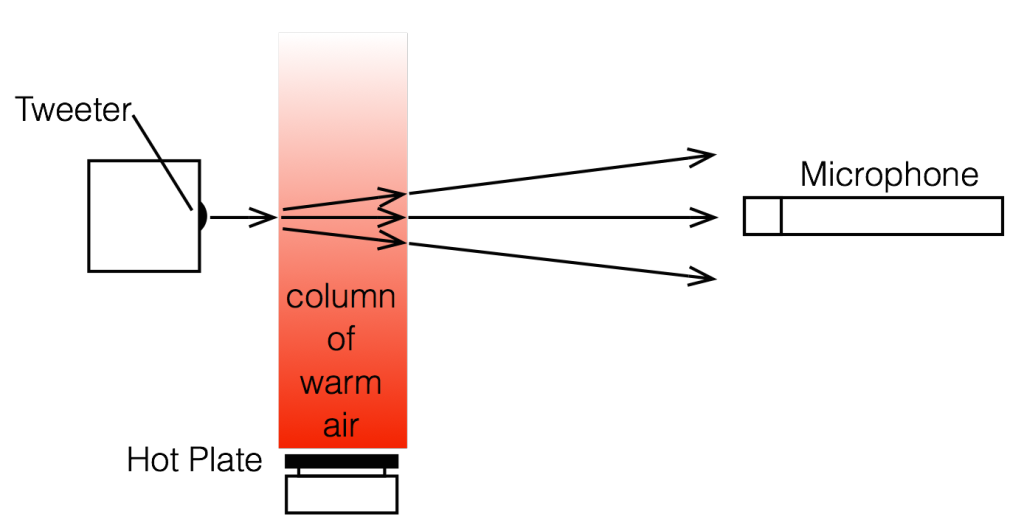
The second explanation is not related to background noise. As you can see in Figure 12, at higher frequencies, there is a definite increase in level variations caused by increasing temperature of the hot plate. However, the effect is too big to be attributed to absorption changes related to temperature changes. So, what is it? Our best guess is that it’s the result of the changes in thermal currents (in other words, the hot air rising) in front of the tweeter resulting in thermal gradients (differences of temperature in space). This causes differences in speed of sound in space causing refraction of the wavefront. The higher the frequency, the more the tweeter is “beaming” so the effect is more evident than it is at low frequencies where the loudspeaker is more omnidirectional. (Spinning a flashlight generates a more obvious than spinning a naked light bulb.) As the temperature changes in time, the sound beam from the tweeter moves towards and away from the microphone input, which looks like a change in level.


Figure 15:
Figure 15: A simplified diagram showing our guess as to why we see a change in magnitude at the microphone.


If we had used a cluster of microphones instead, we would very probably have seen the “beam” moving to another microphone as it went quiet at the main mic… Maybe we’ll do that experiment someday and call it “research” – but for now we have the answer we were looking for, so we’ll leave that one for another day…


The conclusion

So, after all that, our end conclusion was, for an active high-end loudspeaker, we should not put radiators directly below the midranges and tweeters – it’s better to put them behind the loudspeaker like we do already in the BeoLab 5 or BeoLab 20, for example. Or perhaps above the tweeter could also be an option – although that might be a challenge for the visual designers…

There’s no guarantee that the artefacts will be audible (in fact, they almost certainly won’t if you’re not paying attention to the phantom image location, or if you aren’t sitting in the sweet spot… but if those were the case, we probably wouldn’t be talking about a high-end loudspeaker…) but the artefacts are certainly measurable – and that’s enough for us to go looking for a better place to put the amplifier radiators.

And now, I guess this also means that when someone types “loudspeaker amplifier heat phantom image” into Google, they’ll get an answer…


B&O Tech: Beam Width Control – A Primer

#38 in a series of articles about the technology behind Bang & Olufsen loudspeakers

In the last posting, I talked about a little experiment we did that made us realise that control of a loudspeaker’s directivity (or more simply “beam width”) would be a useful parameter in the hands of a listener. And, in a previous article, I talked a little about why that is probably true. This week, let’s get our hands dirty and talk about how Beam Width Control can be accomplished.

Part 1: What is sound?

Okay – we’re really getting back to basics, but it won’t take long. I promise. In order to get to where we’re headed, we have to have a fairly intuitive grasp of what sound is. At a basic level, sound is a change in air pressure over time. Today’s atmospheric (or barometric) pressure is about 100 kiloPascals (give or take). That pressure can be thought of as a measure of the average distances between the air molecules in the room you’re sitting in. It is also important to note that (unless you’re very unlucky and very uncomfortable) the pressure inside your head is roughly the same as the pressure outside your head (otherwise, you’d probably be talking about going to visit a doctor…). The important thing about this is that this means that the pressure that is exerted on the outside of your eardrum (by the air molecules sitting next to it in your ear canal) is almost identical to the pressure that it exerted on the inside of your eardrum (the part that’s inside your head). Since the two sides are being pressed with the same force, then the eardrum stays where it should.

However, if we momentarily change the air pressure outside your head, then you eardrum will be pushed inwards (if the pressure is higher on the outside of your head) or pulled outwards (if the pressure is lower). This small, momentary change in pressure can be caused by many things, but one of those things is, for example, a woofer getting pushed out of its cabinet (thus making a “high pressure” where the air molecules are squeezed closer together than normal) or pulled into its cabinet (thus making a “low pressure” and pulling the air molecules apart).

So, the woofer pushes out of the cabinet, squeezes the air molecules together which push your eardrum into your head which does a bunch of things that result in you hearing a sound like a kick drum.

Part 2: Frequency and wavelength

Take a loudspeaker into your back yard and play a tone with the same pitch as a “Concert A” (the note you use to tune a violin – or, at least, the note violinists use to start tuning a violin…). This note has a frequency of 440 Hz, which means that your loudspeaker will be moving from its resting position, outwards, back, inwards, and back to the resting position (a full cycle of the tone) 440 times every second. This also means that your eardrum is getting pushed inwards and and pulled outwards 440 times every second.

Now, turn off the loudspeaker and walk 344 m away. When you get there, turn on the tone again. You’ll notice that you don’t hear it right away because sound travels pretty slowly in air. In fact, it will take almost exactly one second from the time you turn on the loudspeaker to the time the sound reaches you, since the speed of sound is 344 m/s (you’re 344 m away, so it takes one second for the sound to get to you).

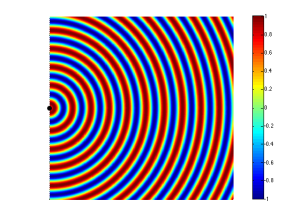
If, at the instant you start to hear the tone, you were able to freeze time – or at least freeze the air molecules between you and the loudspeaker, you’d see something interesting (at least, I think it’s interesting). The instant you hear the start of the tone (the first cycle), the 441st cycle is starting to be generated by the loudspeaker (because it’s producing 440 cycles per second, and it’s been one second since it started playing the tone). This means that, in your frozen-time-world, there are 440 high and low pressure zones “floating” in the 344 m of air between you and the loudspeaker. Given this information, we can calculate how long the length of one wave is (better known as the “wavelength” of the tone). It’s 344 m divided by 440 cycles per second = 78.2 cm.

So, this means that there are 78.2 cm between each high pressure “bump” in the air. This also means that there is half that distance (39.1 cm) between adjacent high and low pressure zones in the air.

Figure 1: High pressure (red) and low pressure (blue) zones radiating outwards from a sound source (the black dot)
Figure 1: High pressure (red) and low pressure (blue) zones radiating outwards from a sound source (the black dot). Note that the scale goes from -1 to 1.


Part 3: Interference

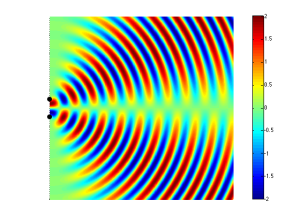
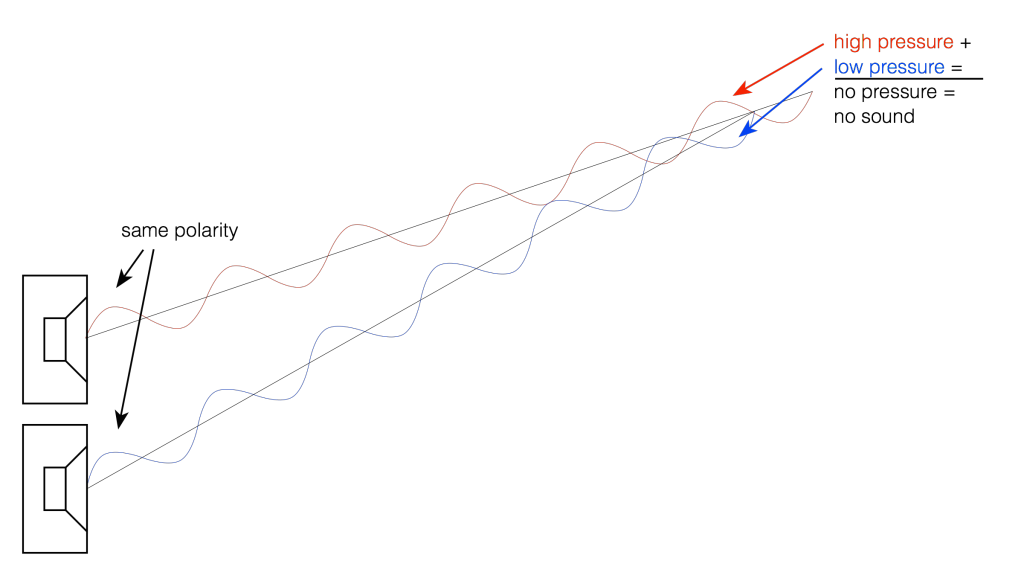
Now let’s take a case where we have two woofers. We’ll put them side by side and we’ll send the same 440 Hz tone to them. So, when one woofer goes out, the other one does as well. This means that each one creates a high pressure in front of it. If you’re exactly the same distance from the two woofers, then those two high pressures add together and you get an even higher pressure at the listening position (assuming that there are no reflecting surfaces nearby). This is called constructive interference. This happens when you have two loudspeaker drivers that are either the same distance from the listening position as in Figure 2 or in exactly the same location (which is not possible), as in Figure 3.


Figure 2: Two sound sources playing the same signal located at the same distance from the listening position.


Figure 2: Two sound sources located in the same position (this is not possible). Note that the pattern of radiation is the same as in Figure 1, it's just twice as much pressure.
Figure 3: Two sound sources located in the same position (this is not possible). Note that the pattern of radiation is the same as in Figure 1, it’s just twice as much pressure – the scale now goes from -2 to 2 because the pressures from the two sources add perfectly in all locations.


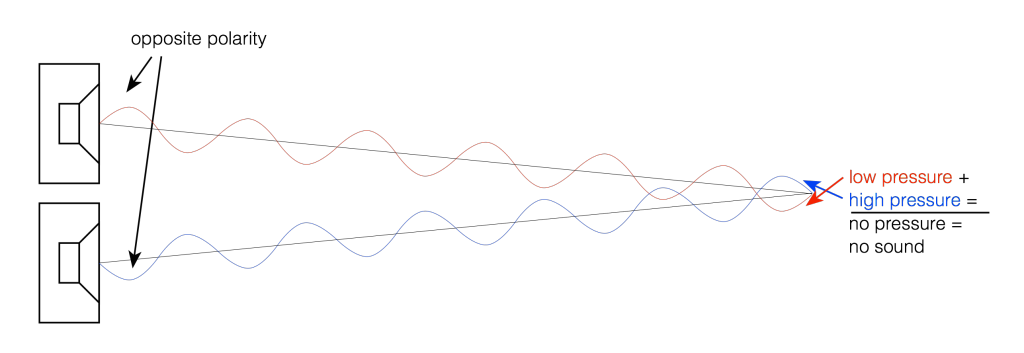
If we change the wiring to the woofers so that they are in opposite polarity, then something different happens. Now, when one woofer goes outwards, the other goes inwards by the same amount. This means that one creates a high pressure in front of it while the other creates a low pressure of the same magnitude. If you’re exactly the same distance from the two woofers, then those two pressures (one high and one low) arrive at the same time and add together, so you get a perfect cancellation at the listening position (assuming that there are no reflecting surfaces nearby). This is called destructive interference. This is shown in Figure 4 and 5.


igure 2: Two sound sources playing the same signal located at the same distance from the listening position.
Figure 4: Two sound sources playing the same signal in opposite polarity located at the same distance from the listening position.


Figure 4. Two sound sources playing the same signal in opposite polarity. Notice that they cancel each other "on axis" to the pair of sources (to the right of the black dots in the figure).
Figure 4. Two sound sources playing the same signal in opposite polarity. Notice that they cancel each other “on axis” to the pair of sources (to the right of the black dots in the figure). The cancellation is seen as a greenish-colour which corresponds to a maximum pressure of 0, or no sound…


However, an important thing about what I just said was that you are the same distance from the two woofers. What if you’re not? Let’s say, for example, that you’ve changed your angle to the “front” of the loudspeaker (which has two loudspeaker drivers). This means that you’re closer to one driver than the other. The result is that, although the two drivers are playing the same signal at the same time, your difference in distance causes their individual signals to have different phases at the listening position – possibly even a completely opposite polarity – as is shown in Figure 5.


igure 2: Two sound sources playing the same signal located at the same distance from the listening position.
Figure 5: Two sound sources playing the same signal located at different distances from the listening position. Notice that, although the signals leave the drivers in the same polarity, they are opposite in polarity at the listening position because the difference in distance results in a difference in time of arrival at the listening position. The more distant driver is farther away by one half of a wavelength in this case.


If you consider Figure 2 and Figure 5 together (they’re really two different views of the same situation, since both loudspeakers are playing the same signal simultaneously) and you include all other listening positions, then you get Figure 6. As you can see there, there is no sound (again, indicated by the greenish colour which means no change in pressure) at the angle shown in Figure 5.

Figure 3: Two sound sources separated by a distance of one wavelength of the tone they are producing. Note that the two sources add perfectly at all distances directly "in front" (to the right, in the figure) because any position on that line is the same distance from each source.
Figure 6: Two sound sources separated by a distance of one wavelength of the tone they are producing. Note that the two sources add perfectly at all distances directly “in front” (to the right, in the figure) because any position on that line is the same distance from each source.


So, Figure 6 shows that, for a position directly in front of the sound sources (to the right of the black dots, in the figure), the result is identical to that in Figure 3 – the two sources add together perfectly if you’re the same distance from them. However, if you start to move away from that line, so that you’re closer to one sound source than the other, then, at some angle, you will get a high pressure from the upper sound source at the same time as you get the previous low pressure from the lower source (because it’s farther away from you, and therefore a bit late in time…) This high+low = nothing, and you hear no sound.


Another, slightly more nuanced way to do this is to not just change the polarity of one of the sound sources, but to alter its phase instead. This is a little like applying a delay to the signal sent to the driver, but it’s a delay that is specific to the frequency that we’re considering. An example of this is shown in Figure 7.

Figure 5. Two sound sources playing the same signal with slightly different phases (delay). Notice that they cancel each other in a different direction than the previous cases.
Figure 7. Two sound sources playing the same signal with slightly different phases (another word for “delay”, sort of…). Notice that they cancel each other in a different direction than the previous cases.

This means that, by changing the phase instead of the polarity of the drivers, I can “steer” the direction of the beam and the “null” (the area where the sound is cancelled out)

It should be noted that, at a different separation of the drivers (more accurately stated: at a different relationship between the wavelength of the signal and the distance between the drivers) , the behaviour would be different. For example, look at Figure 8 which shows the same situation as Figure 6 – the only difference is that the two sound sources are half the distance apart (but the wavelength of the signal has remained the same).

Figure 6: Two sound sources separated by a distance of one wavelength of the tone they are producing. Note that the two sources add perfectly at all distances directly "in front" (to the right, in the figure) because any position on that line is the same distance from each source.
Figure 8: Two sound sources separated by a distance of one half wavelength of the tone they are producing. Compare this to Figure 6.

Part 4: Putting it together

So, at a very basic level (so far) we can determine which direction sound is radiated in based on a relationship between

  1. the wavelength of the signal it is producing (which is a function of its frequency)
  2. the distance between the sound sources (the loudspeaker drivers), and
  3. the polarity and/or the phase of the signals sent to the drivers.

All of the examples shown above assume that the two sound sources (the loudspeaker drivers) are playing at the same level, which is not necessarily the case – we can choose to play a given frequency at whatever level we want using a rather simple filter. So, by reducing the level of the “interfering” driver, we can choose how much the directivity of the radiated sound is affected.

In addition to this, all of the examples shown above assume that the sound sources are omnidirectional – that they radiate sound equally at all frequencies – which is not true in real life. In real life, a loudspeaker driver (like a tweeter or a woofer) has some natural directivity pattern. This pattern is different at different frequencies and is influenced by the physical shapes of the driver and the enclosure it’s mounted on.

So, let’s start putting this together.

If I take a loudspeaker driver – say, a midrange unit – and I mount it on the front of a loudspeaker enclosure and measure its directivity pattern  (the geeky term for the width of its sound beam) across its frequency range and beyond I’ll see something like this:

Figure 9: The horizontal directivity (or "beam width") of a midrange driver mounted on the front of a loudspeaker enclosure.
Figure 9: The horizontal directivity (or “beam width”) of a midrange driver mounted on the front of a loudspeaker enclosure. We don’t care about its behaviour in the very low end very high end (outside the red lines), since those frequency bands are taken care of by woofers and tweeters.

As you can see in that plot, in its low frequency range (the red line on the left), the midrange driver is radiating sound with a wide beam – not completely omnidirectional, but very wide. In its high frequency region (around the right-hand red line) (but still not high enough to be re-routed to the tweeter) the midrange is “beaming” – meaning that the beam is getting too narrow. Our goal is to somehow make the beam widths at these frequency bands (and the ones in between) more alike. So, we want to reduce the width of the beam in the low frequencies and increase the width of the beam in the high frequencies. How can we do this? We’ll use more midrange drivers!

Let’s take two more midrange drivers (one on either side of the “front” or “main” one) and use those to control the beam width. In the lower frequencies, we’ll send a signal to the two side drivers that cancel the energy radiated to the sides of the loudspeaker – this reduces the width of the beam compared to using the front midrange by itself. At higher frequencies, we’ll send a signal to the two side drivers that add to the signal from the front driver to make the width of the beam wider. At a frequency in the middle, we don’t have to do anything, since the width of the beam from the front driver is okay by itself, so at that frequency, we don’t send anything to the adjacent drivers.

“Okay”, I hear you cry, “that’s fine for the beam width looking from the point of view of the front driver, but what happens as I come around towards the rear of the loudspeaker?” Excellent question! As you come around the rear of the loudspeaker, you won’t get much contribution from the front midrange, so the closest “side” midrange driver is the “main” driver in that direction. And, as we saw in the previous paragraph, the signal coming out of that driver is pretty strange (because we intentionally made it strange using the filters – it’s in opposite polarity in its low end, it doesn’t produce anything in its midrange, and it’s quiet, but has a “correct” polarity in its high end). So, we’ll need to put in more midrange drivers to compensate again and clean up the signal heading towards the rear of the loudspeaker. (What we’re doing here is basically the same as we did before, we’re using the “rear” drivers to ensure that all frequencies heading in one rearward direction are equally loud – so we make the “rear” drivers do whatever they have to do at whatever frequency bands they have to do it in to make this true.)

“Okay”, I hear you cry, “that’s fine for the beam width looking from the point of view of the rear of the loudspeaker, but what happens as we go back towards the front of the loudspeaker? Won’t the signals from the rear-facing drivers screw up the signal going forwards?” Excellent question! The answer is “yes”. So, this means that after the signal from the rear-facing midrange drivers is applied (which compensate for the side-facing midrange drivers which compensate for the front facing midrange driver) then we have to go back to the front and find out the effects of the compensation of the compensation on the “original” signal and compensate for that – so we start in a loop where we are compensating for the compensation for the for the compensation for the compensation for the… Well, you get the idea…

The total result is a careful balancing act where some things are known or given:

  • the frequency range of the music being played through a given loudspeaker driver (this is limited by the crossover)
  • the natural directivity patterns of the loudspeaker drivers on the loudspeaker enclosure within that frequency range
  • the locations of the loudspeaker drivers in three-dimensional space
  • the orientations of the loudspeaker drivers in three-dimensional space (in other words, which way they’re pointing)

Note that these last two have been calculated and optimised based on a combination of the natural directivity patterns of the loudspeaker drivers and the desired beam widths we want to make available.

As a result each individual loudspeaker driver gets its own customised filter that controls

  • the level of the signal at any given frequency
  • the phase (which includes delay and polarity – sort of…) of the signal at any given frequency


Figure X: A conceptual illustration showing the different relationships between the various loudspeaker drivers for two different frequencies.
Figure 10: A conceptual illustration showing the different relationships between the various (in this illustration, seven) loudspeaker drivers for two different frequencies. The sum of all loudspeaker drivers results in the same beam width and the same output level on-axis at both frequencies.

By controlling the individual output levels and phases of each loudspeaker driver at each frequency it produces, we can change the overall level of the combined signals from all the loudspeaker drivers in a given direction. If we want to be loud at 0º (on-axis) and 20 dB quieter at 90º (to the side), we just apply the filters to all of the drivers to make that happen. If we want the loudspeaker to be only 10 dB down at 90º, then this just means changing to a different set of filters. This can be done independently at different frequencies – with the end goal to make all frequencies behave more similarly, as I talked about in this posting and this posting.

Also, since the filters are merely settings of the DSP (the digital signal processing “brain” of the loudspeaker), we can change the beam width of the loudspeaker merely by loading different filters – one for each loudspeaker driver in the system.

The end result is a loudspeaker that can play many different roles, as was shown in the different plots in this posting. In one mode, the beam width can be set to “narrow” for situations where you have one chair, and no friends and you want the ultimate “sweet spot” experience for an hour or two. In another mode, the beam width can be set to “wide”, resulting in a directivity that is very much like an improved version of the wide dispersion of the BeoLab 5. In yet another mode, the beam width can be set to “omni”, sending sound in all directions, making a kind of “party mode”.


Part 5: The “side” effect: Beam Direction Control

In order to be able to have a Beam Width Control, a loudspeaker must have a number of identical loudspeaker drivers. A collection of tweeters, midranges and woofers, some on the front, some on the sides and some to the rear of the loudspeaker. In addition, each of these drivers must have its own amplifier and DSP channel so that it is independently controllable by the system.

This means that, instead of using the drivers to merely control the width of the beam in the front of the loudspeaker, they can also be used somewhat differently. We could, instead, decide to “rotate” the sound, so that the “main” tweeter and midrange are the ones on the side (or even the rear) of the loudspeaker instead of the ones on the front. This means that, if you’re sitting in a location that is not directly in front of the loudspeakers (say, to the sides, or even behind), it could be possible to improve the sound quality by “rotating” the “on-axis” direction of the loudspeaker towards your listening position. This by-product of Beam Width Control is called Beam Direction Control.

P.S. Apologies for the pun…


For more information on Beam Width Control:

What is “Beam Width Control”?

Shark Fins and the birth of Beam Width Control

B&O Tech: Shark Fins and the birth of Beam Width Control

#37 in a series of articles about the technology behind Bang & Olufsen loudspeakers

In the last posting, I described a little experiment that we did where we could easily be accused of asking a stupid question and getting an obvious answer. This posting is a little different, although I’ll also describe a little experiment where we asked a much-less-stupid question and got an answer we weren’t looking for… However, before I describe the experiment itself, we’ll have to start with a little background information.

Let’s say that we wanted to build a “simple” two-way loudspeaker with a tweeter and a woofer in a box like the one shown in Figure 1.

Figure 1. A simple two-way loudspeaker
Figure 1. A simple two-way loudspeaker.

Since we’re Bang & Olufsen, it is implied that this will be a fully active, DSP-based loudspeaker. Let’s also, for the sake of simplicity, say that we used loudspeaker drivers and other components with absolutely no linear distortion artefacts (I can dream, can’t I?). This means that we can apply any kind of filter we like to each of the two loudspeaker drivers to result in whatever response we want (in a given direction in a “free field” (a space with no reflecting surfaces, extending to infinity in all directions) – for more information on this, please read this posting and/or this posting).

Now, it’s fairly reasonable to assume that one portion of a good starting point for a loudspeaker’s acoustic response is to have a flat magnitude response when measured on-axis in a free field. This means that, if you have the loudspeaker in a space that has no reflections, and you are directly in front of it, no frequency will be louder than any other (within some limits, of course…). In fact, this is the way a lot of studio monitor loudspeakers are tuned (which makes sense, since many studio control rooms don’t have a lot of reflections as was discussed here).

The problem is that, if you do make a loudspeaker that is flat-on-axis, you’ll probably have problems in its power response (for a description of what a loudspeaker’s “power response” is, see here). This is dependent on a lot of things like the crossover frequency, the sizes and shapes of the drivers, the phase responses of the crossover filters, the shape of the cabinet, and other things. However, if we were to simplify, we could say that a two-way loudspeaker (say, with a 4th order Linkwitz-Riley crossover, just to pick one type…) that is flat on-axis, will have a dip in its power response at the crossover frequency. This is because, although the two drivers (the tweeter and the woofer) add together nicely in one location (on-axis, directly in front of the loudspeaker) they do not add together nicely anywhere else (because the distances to the two drivers from the listening position are probably not matched, particularly when you go vertical…).

So, one basic problem with building a “simple” two-way loudspeaker is that you have to choose to either have a flat magnitude response on-axis, or a smooth power response (without a dip) – but you can’t have both. (If you want to really dig into this, I’d recommend starting with J. Vanderkooy & S.P. Lipshitz, “Power Response of Loudspeakers with Noncoincident Drivers — The Influence of Crossover Design,” J. Audio Eng. Soc., Vol. 34, No. 4, pp. 236-244 (Apr. 1986).)

This basic problem raised a question in the head of one of our acoustical engineers, Gert Munch. He started to wonder how we could build a loudspeaker that could have a flat magnitude response on-axis and still have a smooth power response that didn’t suffer from a dip at the crossover. One possible solution is to build a loudspeaker with the desired on-axis response, and then somehow create an additional portion of the loudspeaker that could “fill up” the dip in the power response by sending energy into the room without it affecting the on-axis response.

One possible way to do this is to use an extra loudspeaker with a “dipole” characteristic – a two-sided loudspeaker where the same signal is sent to both sides, but in opposite polarity. This means that, when one side of the loudspeaker produces a high pressure, the other side produces a low. When you sit on one side of the loudspeaker or the other, then you hear a signal. However, if you sit “on edge” to the loudspeaker, you hear nothing, since the two sides of the loudspeaker cancel each other out (in theory).

So, Gert’s idea was to add a two-way dipole loudspeaker on the top of a normal two-way loudspeaker and to just use the dipole (which became known as a “shark fin” – shown in Figure 2)  to add energy around the crossover frequency of the “normal” loudspeaker. Since the edge of the dipole was facing forwards, the theory was that none of its sound would have an effect on the on-axis response of the two-way loudspeaker below it.

Figure 2. A two-way loudspeaker with a side-facing dipole loudspeaker on top.
Figure 2. A two-way loudspeaker with a side-facing dipole loudspeaker on top. Note that the other side of the dipole looks identical to the one you see.


So, the question to answer was:

“Which sounds better:

  • a loudspeaker tuned to be flat on-axis, but with no correction for its power response
  • a loudspeaker that was tuned to have a smooth power response (in other words, with a “bump” around the crossover)
  • a loudspeaker that was tuned to be flat on-axis and had a power response correction provided by the dipole

?”

Since each of the 6 loudspeaker drivers in our model loudspeaker was independently controllable, this was an easy comparison to do on-the-fly, so we tried it out.

Also, just to be certain, we tried two different orientations of the dipole, both of which had the “null” – the edge of the loudspeaker – facing the listening position. The first orientation is shown in Figures 2 and 3. The second orientation is shown in Figure 4.


Figure 3. The dipoles in the first orientation.


Figure 3. The dipoles in a second orientation.
Figure 4. The dipoles in a second orientation.


So, a bunch of us sat in the listening room for a week or so, listening to the various possible tunings of the loudspeakers, in various positions in the room, with various types of music. We each had an opinion about the whether we liked one configuration more or less than another. However, one thing that was noticeable was that there was an effect not only on the timbral impression of the loudspeakers (the tone colour) – but also on the spatial presentation of the pair. As we switched between the different tunings, phantom images changed in width and distance, and envelopment (when it existed in the recording) also changed.

This was particularly noticeable when the loudspeakers were closer to a reflecting surface, as is shown in Figure 5.

Figure 5. A listening configuration where one loudspeaker was intentionally placed close to a reflecting surface.


The end result was a bunch of different conclusions:

  1. The three different configurations of the loudspeaker (listed above) sounded different. (this was not a big surprise)
  2. A two-way loudspeaker tuned to have a smooth power response and a loudspeaker with a flat on-axis response with a shark fin smoothing the power response sounded different – but mostly spatially.
  3. Switching between those two loudspeaker configurations listed in Point #2 basically meant that we were switching between two different loudspeakers with the same power response, but different directivities (a fancy word meaning “directional behaviours”).
  4. The dipole loudspeaker’s output was audible at the listening position because of the sidewall reflections in the case where the dipole was on top.
  5. Switching the dipole on and off had a noticeable effect on the phantom image distance and width… When the dipole was turned on, the sidewall reflections were obviously louder, and the phantom images moved to a distance from the listening position roughly the same as the distance to the loudspeakers themselves. At the same time, the phantom image width increased and became “cloudy” or “fuzzy” and less precise.


All of those little conclusions could be folded into two big ones:

  1. The original idea of using a dipole to fill in the power response of the loudspeaker doesn’t work well enough in all situations because we don’t know where the reflective surfaces around the loudspeaker will be in any given configuration.
  2. Being able to control the directivity of the loudspeaker (specifically, how much energy is coming from the sidewall reflections) is a very interesting control parameter that we should look into…


So, this is where the concept of the shark fin died, but where the idea of “Beam Width Control” began.

Well… more accurately: it was the beginning of our thinking that being able to change the beam width (or the “directivity”, if you’re a geek) of the loudspeaker would be a useful “handle” in the hands of our customers. The idea that was born was something along the lines of the following: “If a customer could change the beam width of a loudspeaker, then (s)he could change it from being a narrow-directivity loudspeaker for people with one chair and no friends to a wide-directivity loudspeaker for people with a sofa and some friends to an omni-directivity loudspeaker for people throwing a party – all just by the flick of a switch…”


For more information on Beam Width Control:

What is “Beam Width Control”?

Beam Width Control – A Primer

B&O Tech: It’s lonely at the top

#36 in a series of articles about the technology behind Bang & Olufsen loudspeakers


“In all affairs it’s a healthy thing now and then to hang a question mark on the things you have long taken for granted.”

-Bertrand Russell


If you were to get your hands on Harry Potter’s invisibility cloak and you were to walk into the acoustics department at Bang & Olufsen and eavesdrop on conversations, you’d sometimes be amazed at some of the questions we ask each other. That’s particularly true when we’re working on a new concept, because, if the concept is new, then it’s also new for us. The good thing is that all of my colleagues (and I) are ready and willing at any time to ask what might be considered to be a stupid (or at least a very basic) question.

One of those questions that we asked each other recently seemed like a basic one – why do we always put the tweeter on the top? It seems like there are very few loudspeakers that don’t do this (of course, there are exceptions – take the BeoLab Penta, for example, which has the tweeter in the middle). However, more often than not, when we (and most other people) make a loudspeaker, we put the loudspeaker drivers in ascending order of frequency – woofers on the bottom, tweeters on the top. Maybe this is because woofers are heavier, and if you stand a BeoLab 5 on its head, it will fall over – but that’s not really the question we were asking…

The REAL question we were asking ourselves at the time was: if we were to build a multi-way loudspeaker – let’s say a 3-way, with a woofer, a midrange and a tweeter, and if the crossovers were such that the bulk of the “interesting” information (say, the vocal range) was coming from the midrange, then why would we not put the midrange at ear height and put the tweeter between it and the woofer? For example, imagine we made BeoLab 20 without an Acoustic Lens on top, would it be better to arrange the drivers like the version on the left of Figure 1 or the version on the right? Which one would sound better?


Figure 1: Two versions of a BeoLab 20-like loudspeaker with different driver arrangements.


After answering that question, there’s a second question would follow closely behind: how close together do the drivers with adjacent frequency bands (i.e. the woofer and the midrange or the tweeter and the midrange) have to be in order for them to sound like one thing? Of course, these two questions are inter-related. If your midrange and tweeter are so far apart that they sound like different sound sources, then you would probably be more interested in where the voice was coming from than where the cymbals were coming from…

Of course, step one in answering the second question could be to calculate/simulate the response of the loudspeaker, based on distance between drivers, the crossover frequency (and therefore the wavelengths of the frequency band we’re interested in), the slopes of the crossover filters, and so on. It would also be pretty easy to make a prototype model out of MDF, put the loudspeaker drivers in there, do the vertical directivity measurements of the system in the Cube, and see how well the theory matches reality.

However, the question we were really interested in was “but how would it sound?” – just to get a rough idea before going any further. And I have to stress here that we were really talking about getting a rough idea. What I’m about to describe to you is a little undertaking that we put together in a day – just to find out what would happen. This was not a big, scientifically-valid experiment using a large number of subjects and intensive statistics to evaluate the results. It was a couple of guys having a chat over coffee one morning when one of them said “I wonder what would happen if we put the midrange on top…” and then, off they went to a listening room to find out.

One thing we have learned in doing both “quick-n-dirty” listening comparisons and “real, scientifically valid listening tests” is that the placement of a loudspeaker in a room, has a huge effect on how the loudspeaker sounds. So, when we’re comparing two loudspeakers, we try to put them as close together as possible. So, we tried different versions of this. In the first, we took two pairs of loudspeakers, and put the left loudspeakers in each pair side-by-side, with one pair upside down and the other right-side up, as shown in Figure 2.


Figure X: Another arrangement of the loudspeakers used in the first part of the experiment.
Figure 2: One arrangement of the loudspeakers used in the first part of the experiment. “Pair A” is in black and “Pair B” is in red.


We then switched between the right-side up pair and the upside down pair, listening for a change in vertical position of the image. Note that we tried two arrangements of this – one where both right-side up loudspeakers were to the left of the upside-down loudspeakers. The other where the “right-side up” loudspeakers were the “outside” pair, as shown in Figure 3.

Figure X: Another arrangement of the loudspeakers used in the first part of the experiment.
Figure 3: Another arrangement of the loudspeakers used in the first part of the experiment.


There are advantages and disadvantages of both of these arrangements – but in both cases, there is a lateral shift in the stereo image. When switching between pairs, either you get a left-right shift in image, or a change in width… It turned out that this change was more distracting than the vertical arrangement of the drivers, so we changed configuration to the one shown in Figure 4, below.

Figure X: Another arrangement of the loudspeakers used in the first part of the experiment.
Figure 4: Another arrangement of the loudspeakers used in the first part of the experiment. Note that, in this version, we used the loudspeaker pairs differently. “Pair A” used the red loudspeakers as tweeters and the black loudspeakers as woofers using an external crossover. “Pair B” used the red loudspeakers as woofers and the black loudspeakers as tweeters.


Now, instead of switching between loudspeakers, we pretended that one of them was a tweeter and other was a mid-woofer, and switched which was which, on the fly. Our “virtual” crossover was close-ish to the real crossover in the loudspeakers (our crossover was at 3.5 kHz, if you’re curious), so you could say that we were sort-of changing between using the upper tweeter + the lower woofer and using the upper woofer + lower tweeter, the “acoustical centres” of which are roughly at the same height. (remember – this was a quick-n-dirty experiment…)


Figure X: A photo of the loudspeakers used in the first part of the experiment.
Figure 5: A photo of one configuration of the  loudspeakers used in the first part of the experiment. Note that the BeoLab 9 and the BeoPlay V1 were not part of the experiment – we just didn’t bother to clean up before getting busy…


Figure X: A photo of the loudspeakers used in the first part of the experiment.
Figure 6: A photo of one configuration of the loudspeakers used in the first part of the experiment.


After having listened to these three configurations of loudspeakers, we decided that the vertical arrangement of the drivers was not important with the vertical separation we were using.

This brought us to the second part of the question… If the tweeter and the midrange were further apart, would we have a preference? So, we kept our virtual crossover, using one loudspeaker as the “tweeter” and the other as the “mid-woofer”, and we moved the loudspeakers further apart, one example of which is shown in Figure 7. (One thing to note here is that when I say “further apart” I’m talking about the separation in the vertical angles of the sources – not necessarily their actual distance from each other. For example, if the loudspeakers were 1 m apart vertically, and you were level with one of the loudspeakers, but the listening position was a kilometre away, then the vertical angular separation (0.057 degrees) would be much smaller than if you were 1 m away (45 degrees)…)


Figure X: A photo of the loudspeakers used in the second part of the experiment.
Figure 7: A photo of the loudspeakers used in the second part of the experiment. This was one (extreme) example of a vertical separation.

The answer we arrived at at the end was that, when the vertical separation of the drivers gets extreme (perhaps I should use the word “silly” instead), we preferred the configuration where the “mid-woofer” was at ear-height. However, this was basically a choice of which version we disliked less (“preference” is a loaded word…). When the drivers get far enough apart, of course, they no longer “hang together” as a single device without some extra signal processing tricks.

So, we went to lunch having made the decision that, as long as the tweeters and the midranges are close enough to each other vertically, we really didn’t have a preference as to which was on top, so, if anyone asked, we would let the visual designers decide. (Remember that “close enough” is not only determined by this little experiment – it is also determined by the wavelengths of the crossover frequencies and whether or not there are more drivers to consider. For example, in the example in Figure 1, it might be that we don’t care about the relative placement of the tweeter and midrange in isolation – but perhaps putting the tweeter between the midrange and woofer will make them too far apart to have a nice vertical directivity behaviour across the lower crossover…)


Addendum

This isn’t the first time we asked ourselves such a question. Although I was not yet working at B&O at the time, my colleagues tell me that, back in the days when they were developing the BeoLab 3500 and the BeoLab 7-1 (both of which are “stereo” loudspeakers – essentially two multi-way loudspeakers in a single device) , they questioned the driver arrangement as well. Should the tweeters or the midranges / woofers be on the outside? You can see in the photos of the 3500 on this page that they decided to put the lower-frequency bands wider because the overall impression with stereo signals was wider than if the tweeters were on the outside.


B&O Tech: Active Room Compensation

#35 in a series of articles about the technology behind Bang & Olufsen loudspeakers


Introduction:
Why do I need to compensate for my room?

Take a look at Figure 1. You’ll see a pair of headphones (BeoPlay H6‘s, if you’re curious…) sitting under a lamp that is lighting them directly. (That lamp is the only light source in the room. I can’t prove it, so you’ll have to trust me on this one…) You can see the headphones because the light is shining on them, right? Well… sort of.

Figure X: An object being lit with direct and reflected light.
Figure 1: An object being lit with direct and reflected light.

What happens if we put something between the lamp and the headphones? Take a look at Figure 2, which was taken with the same camera, the same lens, the same shutter speed, the same F-stop, and the same ISO (in other words, I’m not playing any tricks on you – I promise…).

Figure X: An object being lit with reflected light only.
Figure 2: An object being lit with reflected light only.

Notice that you can still see the headphones, even though there is no direct light shining on them. This probably does not come as a surprise, since there is a mirror next to them – so there is enough light bouncing off the mirror to reflect enough light back to the headphones so that we can still see them. In fact, there’s enough light from the mirror that we can see the shadow caused by the reflected lamp (which is also visible in Figure 1, if you’re paying attention…).

If you don’t believe me, look around the room you’re sitting in right now. You can probably see everything in it – even the things that do not have light shining directly on them (for example, the wall behind an open door, or the floor beneath your feet if you lift them a little…)

Exactly the same is true for sound. Let’s turn the lamp into a loudspeaker and the headphones on the floor into you, in the listening position and send a “click” sound (what we geeks call an “impulse”) out of the loudspeaker. What arrives at the listening position? This is illustrated in Figure 3, which is what we call an “impulse response” – how a room responds to an impulse (a click coming from a loudspeaker).

Figure X: The Impulse Response of a loudspeaker in a room at one location. The top plot shows the impulse (a "click" sound) sent to the loudspeaker. The bottom plot shows the sound received at the listening position.
Figure 3: The Impulse Response of a loudspeaker in a room at one location. The top plot shows the impulse (a “click” sound) sent to the loudspeaker. The bottom plot shows the sound received at the listening position.


The top plot in Figure 1 shows the signal that is sent to the input of the loudspeaker. The bottom plot is the signal at the input of the microphone placed at the listening room. If we zoom in on the bottom plot, the result is Figure 4. This makes it much easier to see the direct sound and the reflections as separate components.

Figure X: A zoom of the bottom plot in Figure X.
Figure 4: A zoom of the bottom plot in Figure 3.

If we zoom in even further to the beginning of the plot in Figure 4, we can see individual reflections in the room’s response, as is shown in Figure 5.

Figure X: A zoom of the plot in Figure X showing the direct sound and some of the reflections off of surfaces in the room. Note that the first reflection is only about 12 dB quieter than the direct sound.
Figure 5: A zoom of the plot in Figure 4 showing the direct sound and some of the reflections off of surfaces in the room. Note that the first reflection is only about 12 dB quieter than the direct sound.


Let’s take the total impulse response and separate the direct sound from the rest. This is shown in Figure 6.


Figure X: The impulse response of a loudspeaker in a room, separating the direct sound (in red) from the reflections (in blue).
Figure 6: The impulse response of a loudspeaker in a room, separating the direct sound (in red) from the reflections (in blue).


We can then calculate the magnitude responses of the two separate components individually to see what their relative contributions are – shown in Figure 7.


Figure X: The magnitude responses of the separate components of the total impulse response in Figure X. Red: Direct sound, Blue: Reflections.
Figure 7: The magnitude responses of the separate components of the total impulse response in Figure 6. Red: Direct sound, Blue: Reflections. 1/3 octave smoothed


Now, before you get carried away, I have to say up-front that this plot is a little misleading for many reasons – but I’ll only mention two…

The first is that it shows that the direct sound is quieter than the reflected sound in almost all frequency bands, but as you can see in Figure 6, the reflected energy is never actually louder than the direct sound. However, the reflected energy lasts for much longer than the direct sound, which is why the analysis “sees” it as containing more energy – but you don’t hear the decay in the room’s response at the same time when you play a click out of the loudspeaker. Then again, you usually don’t listen to a click – you listen to music, so you’re listening to the end of the room decay on the music that happened a second ago while you’re listening to the middle of the decay on the music that happened a half-second ago while you’re listening to the direct sound of the music that happened just now… So, at any given time, if you’re playing music (assuming that this music was constantly loud – like Metallica, for example…), you’re hearing a lot of energy from the room smearing music from the recent past, compared to the amount of energy in the direct sound which is the most recent thing to come out of the loudspeaker.

The second is in the apparent magnitude response of the direct sound. It appears from the red curve in Figure 7 that this loudspeaker has a response that lacks low frequency energy. This is not actually true – the loudspeaker that I used for this measurement actually has a flat on-axis magnitude response within about 1 dB from well below 20 Hz to well above 20 kHz. However, in order to see that actual response of the loudspeaker, I would have to use a much longer slice of time than the little red spike shown in Figure 6. In other words, the weirdness in the magnitude response is an artefact of the time-slicing of the impulse response. The details of this are complicated, so I won’t bother explaining it in this article – you’ll just have to trust me when I say that that isn’t really the actual response of the loudspeaker in free space…

The “punch line” for all of this is that the room has a significant influence on the perceived sound of the loudspeaker (something I talked about in more detail in this article). The more reflective the surfaces in the room, the more influence it has on the sound. (Also, the more omnidirectional the loudspeaker, the more energy it sends in more directions in the room, which also will mean that the room has more influence on the total sound at the listening position… but there’s more information about that in the article on Beam Width Control.)

So, if the room has a significant influence on the sound of the loudspeaker at the listening position, then it’s smart to want to do something about it. In a best case (and very generally speaking…), we would want to measure the effects that the room has on the overall sound of the loudspeaker and “undo” them. The problem is that we can’t actually undo them without changing the room itself. However, we can make some compensation for some aspects of the effects of the room. For example, one of the obvious things in the blue curve in Figure 7 is that the listening room I did the measurement in  has a nasty resonance in the low end (specifically, it’s at about 57 Hz which is the second axial mode for the depth of the room which is about 6 m). It would certainly help the overall sound of the loudspeaker to put in a notch filter at that frequency – in a best case, we should measure the phase response of the room’s resonance and insert a filter that has the opposite phase response. But that’s just the beginning with one mode – there are lots more things to fix…


A short history

Almost all Bang & Olufsen loudspeakers have a switch that allows you to change its magnitude response to compensate for the position of the loudspeaker in the room. This is typically called a Free/Wall/Corner switch, since it’s designed to offset the changes to the timbre of the loudspeaker caused by the closest boundaries. There’s a whole article about this effect and how we make a filter to compensate for it at this link.

In 2002, Bang & Olufsen took this a step further when it introduced the BeoLab 5 which included ABC – Automatic Bass Calibration. This was a system that uses a microphone to measure the effects of the listening room’s acoustical behaviour on the sound of the loudspeaker, and then creates a filter that compensates for those effects in the low frequency band. As a simple example, if your room tends to increase the apparent bass level, then the BeoLab 5’s reduce their bass level by the same amount. This system works very well, but it has some drawbacks. Specifically, ABC is designed to improve the response of the loudspeaker averaged over all locations in the room. However this follows the philosophy first stated Spock said in Star Trek II: The Wrath of Kahn when he said “the needs of the many outweigh the needs of the few, or the one.” In other words, in order to make the averaged response of the loudspeaker better in all locations in the room, it could be that the response at one location in the room (say, the “sweet spot” for example…) gets worse (whatever that might mean…). This philosophy behind ABC makes sense in BeoLab 5, since it is designed as a loudspeaker that has a wide horizontal directivity – meaning it is designed as a loudspeaker for “social” listening, not as a loudspeaker for someone with one chair and no friends… Therefore an improved average room response would “win” in importance over an improved sweet spot.


Active Room Compensation

We are currently working on a taking this concept to a new level with Active Room Compensation. Using an external microphone, we can measure the effects of the room’s acoustical behaviour in different zones in the room and subsequently optimise compensation filters for different situations. For example, in order to duplicate the behaviour of BeoLab 5’s ABC, we just need to use the microphone to measure a number of widely-space locations around the room, thus giving us a total average for the space. However, if we want to create a room compensation filter for a single location – the sweet spot, for example – then we can restrict the locations of the microphone measurements to that area within the room. If we want to have a compensation filter that is pretty good for the whole room, but has emphasis on the sweet spot, we just have to make more measurements in the sweet spot than in the rest of the room. The weighting of importance of different locations in the room can be determined by the number of microphone measurements we do in each location. Of course, this isn’s as simple a procedure as pressing one button, as in ABC on the BeoLab 5, but it has the advantage in the ability to create a compensation filter for a specific location instead of for the whole listening space.

As part of this work, we are developing a new concept in acoustical room compensation: multichannel processing. This means that the loudspeakers not only “see” each other as having an effect on the room – but they help each other to control the room’s acoustical influence. So, if you play music in the left loudspeaker only, then some sound will also come out of the right loudspeaker. This is because both the left and right loudspeakers are working together to control the room (which is being “activated” by sound only from the left loudspeaker.


B&O Tech: What is “Beam Width Control”?

#34 in a series of articles about the technology behind Bang & Olufsen loudspeakers


A little background:
Distance Perception in “Real Life”

Go to the middle of a snow-covered frozen lake with a loudspeaker, a chair, and a friend. Sit on the chair, close your eyes and get your friend to place the loudspeaker some distance from you. Keep your eyes closed, play some sounds out of the loudspeaker and try to estimate how far away it is. You will be wrong (unless you’re VERY lucky). Why? It’s because, in real life with real sources in real spaces, distance information (in other words, the information that tells you how far away a sound source is) comes mainly from the relationship between the direct sound and the early reflections that come at you horizontally. If you get the direct sound only, then you get no distance information. Add the early reflections and you can very easily tell how far away it is. If you’re interested in digging into this on a more geeky level, this report is a good starting point.

A little more background:
Distance perception in a recording

Recording engineers use this information as a trick to simulate differences in apparent distance to sound sources in a stereo recording by playing with the so-called “dry-wet” ratio – in other words, the relative levels of the direct sound and the reverb. I first learned this in the little booklet that came with my first piece of recording gear – an Alesis Microverb (1st generation… It was a while ago…). To be honest – this is a bit of an over-simplification, but it’s good enough to work (for example, listen to the reverberation on Grover’s voice change as he moves from “near” to “far” in this video). The people at another reverb unit manufacturer know that the truth requires a little more details. For example, their flagship reverb unit uses correctly-positioned and correctly-delayed early reflections to deliver a believable room size and sound source location in that room.

Recording Studios vs. Living Rooms

When a recording engineer makes a recording in a well-designed studio, he or she is sitting not only in a carefully-designed acoustical space, but a very special area within that space. In many recording studios, there is an area behind the mixing console where there are no (or at least almost no) reflections from the sidewalls . This is accomplished either by putting acoustically absorptive materials on the walls to soak up the sound so it cannot reflect (as shown in Figure 1), or to angle the walls so that the reflections are directed away from the listening position (as shown in Figure 2).

Figure 1: A typical floorplan for a recording studio that was built inside an existing room. The large rectangle is the recording console. The blue triangles are acoustically absorptive materials.


Figure 1: A typical floorplan for a recording studio that was designed for the purpose. The large rectangle is the recording console.
Figure 2: A typical floorplan for a recording studio that was designed for the purpose. The large rectangle is the recording console. Note that the side walls are angled to reflect energy away from the listening position.

Both of these are significantly different from what happens in a typical domestic listening room (in other words, your living room) where the walls on either side of the listening position are usually  acoustically reflective, as is shown in Figure 3.

Figure 3: A typical floorplan for a living room used as a listening room.


In order to get the same acoustical behaviour at the listening position in your living room that the recording engineer had in the studio, we will have to reduce the amount of energy that is reflected off the side walls. If we do not want to change the room, one way to do this is to change the behaviour of the loudspeaker by focusing the beam of sound so that it stays directed at the listening position, but it sends less sound to the sides, towards the walls, as is shown in Figure 4.

Figure 4: A representation of a system using loudspeakers that send less energy towards the sidewalls.
Figure 4: A representation of a system using loudspeakers that send less energy towards the sidewalls. Note that there are still sidewall reflections – they’re just less noticeable.

So, if you could reduce the width of the beam of sound directed out the front of the loudspeaker to be narrower to reduce the level of sidewall reflections, you would get a more accurate representation of the sound the recording engineer heard when the recording was made. This is because, although you still have sidewalls that are reflective, there is less energy going towards them that will reflect to the listening position.

However, if you’re sharing your music with friends or family, depending on where people are sitting, the beam may be too narrow to ensure that everyone has the same experience. In this case, it may be desirable to make the loudspeaker’s sound beam wider. Of course, this can be extended to its extreme where the loudspeaker’s beam width is extended to radiate sound in all directions equally. This may be a good setting for cases where you have many people moving around the listening space, as may be the case at a party, for example.

For the past 5 or 6 years, we in the acoustics department at Bang & Olufsen have been working on a loudspeaker technology that allows us to change this radiation pattern using a system we call Beam Width Control. Using lots of DSP power, racks of amplifiers, and loudspeaker drivers, we are able to not only create the beam width that we want (or switch on-the-fly between different beam widths), but we can do so over a wide frequency range. This allows us to listen to the results, and design the directivity pattern of a loudspeaker, just as we currently design its timbral characteristics by sculpting its magnitude response. This means that we can not only decide how a loudspeaker “sounds” – but how it represents the spatial properties of the recording.


What does Beam Width Control do?

Let’s start by taking a simple recording – Susanne Vega singing “Tom’s Diner”. This is a song that consists only of a fairly dryly-recorded voice without any accompanying instruments. If you play this tune over “normal” multi-way loudspeakers, the distance to the voice can (depending on the specifics of the loudspeakers and the listening room’s reflective surfaces) sound a little odd.  As I discussed in more detail in this article, different beam widths (or, if you’re a little geeky – “differences in directivity”) at different frequency bands can cause artefacts like Vega’s “t’s” and “‘s’s” appearing to be closer to you than her vowel sounds, as I have tried to represent in Figure 5.

Figure X: A spatial map representing the location of the voice in Suzanne Vega's recording of Tom's Diner. Beam Width = off.
Figure 5: A spatial map representing the location of the voice in Suzanne Vega’s recording of Tom’s Diner. Beam Width Control = off. Note that the actual experience is that some frequency bands in her voice appear closer than others. This is due to the fact that the loudspeakers have different directivities at different frequencies.


Figure 6: The directivity of the system as a "normal" multi-way loudspeaker.
Figure 6: The directivity of the system as a “normal” multi-way loudspeaker. 3 dB per contour to -12 dB relative to on-axis.

If you then switch to a loudspeaker with a narrow beam width (such as that shown in the directivity plot in Figure 7 – the beam width is the vertical thickness of the shape in the plot – note that it’s wide in the low frequencies and narrowest at 10,000 Hz), you don’t get much energy reflected off the side walls of the listening room. You should also notice that the contour lines are almost parallel, which means that the same beam width doesn’t change as much with frequency.

Figure 7: The directivity of the system in "narrow" beam width.
Figure 7: The directivity of the system in “narrow” beam width. 3 dB per contour to -12 dB relative to on-axis.

Since there is very little reflected energy in the recording itself, the result is that the voice seems to float in space as a pinpoint, roughly half-way between the listening position and the loudspeakers – much as was the case of the sound of your friend on the snow-covered lake. In addition, as you can see in Figure 7, the beam width of the loudspeaker’s radiation is almost the same at all frequencies – which means that, not only does Vega’s voice float in a location between you and the loudspeakers, but all frequency bands of her voice appear to be the same distance from you. This is represented in Figure 8.

Figure X: A spatial map representing the location of the voice in Suzanne Vega's recording of Tom's Diner. Beam Width = narrow.
Figure 8: A spatial map representing the location of the voice in Suzanne Vega’s recording of Tom’s Diner. Beam Width = narrow.

If we then switch to a completely different beam width that sends sound in all directions, making a kind of omnidirectional loudspeaker (with a directivity response as is shown in Figure 9), then there are at least three significant changes in the perceived sound. (If you’re familiar with such plots, you’ll be able to see the “lobing” and diffraction caused by various things, including the hard corners on our MDF loudspeaker enclosures. See this article for more information about this little issue… )

Figure 8: The directivity of the system in "omni" beam width.
Figure 9: The directivity of the system in “omni” beam width. 3 dB per contour to -12 dB relative to on-axis.

The first big change is that the timbre of the voice is considerably different – particularly in the mid-range (although you could easily argue that this particular recording only has mid-range…). This is caused by the “addition” of reflections from the listening room’s walls at the listening position (since we’re now sending more energy towards the room boundaries). The second change is in the apparent distance to the voice. It now appears to be floating at a distance that is the same as the distance to the loudspeakers from the listening position. (In other words, she moved away from you…). The third change is in the apparent width of the phantom image – it becomes much wider and “fuzzier” – like a slightly wide cloud floating between the loudspeakers (instead of a pin-point location). The total result is represented in Figure 10, below.
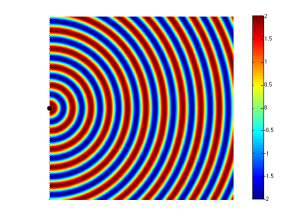
Figure X: A spatial map representing the location of the voice in Suzanne Vega's recording of Tom's Diner. Beam Width = omni.
Figure 10: A spatial map representing the location of the voice in Suzanne Vega’s recording of Tom’s Diner. Beam Width = omni.


All three of these artefacts are the result of the increased energy from the wall reflections.

Of course, we don’t need to go from a very narrow to an omnidirectional beam width. We could find a “middle ground” – similar to the 180º beam width of BeoLab 5 and call that “wide”. The result of this is shown in Figures 11 and 12, with a measurement of the BeoLab 5’s directivity shown for comparison in Figure 13.

Figure 8: The directivity of the system in "wide" beam width.
Figure 11: The directivity of the system in “wide” beam width. 3 dB per contour to -12 dB relative to on-axis.


Figure X: A spatial map representing the location of the voice in Suzanne Vega's recording of Tom's Diner. Beam Width = wide.
Figure 12: A spatial map representing the location of the voice in Suzanne Vega’s recording of Tom’s Diner. Beam Width = wide.


Figure 8: The directivity of a BeoLab 5.
Figure 13: The directivity of a BeoLab 5.

If we do the same comparison using a more complex mix (say, Jennifer Warnes singing “Bird on a Wire” for example) the difference in the spatial representation is something like that which is shown in Figures 14 and 15. (Compare these to the map shown in this article.) Please note that these are merely an “artist’s rendition” of the effect and should not be taken as precise representations of the perceived spatial representation of the mixes. Actual results will certainly vary from listener to listener, room to room, and with changes in loudspeaker placement relative to room boundaries.


Figure X: A spatial map representing the locations of some of the sound sources in Jennifer Warnes's recording of Bird on a Wire. Beam Width = narrow.
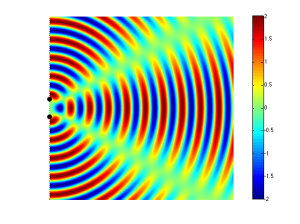
Figure 14: A spatial map representing the locations of some of the sound sources in Jennifer Warnes’s recording of Bird on a Wire. Beam Width = narrow.
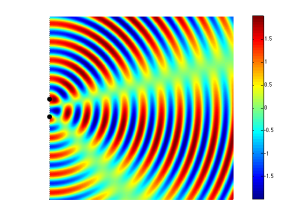
 

Figure X: A spatial map representing the locations of some of the sound sources in Jennifer Warnes's recording of Bird on a Wire. Beam Width = wide.
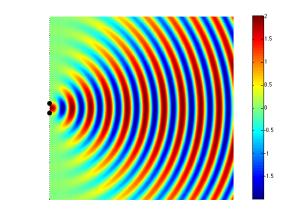
Figure 15: A spatial map representing the locations of some of the sound sources in Jennifer Warnes’s recording of Bird on a Wire. Beam Width = wide.


Of course, everything I’ve said above assumes that you’re sitting in the “sweet spot” – a location equidistant to the two loudspeakers at which both loudspeakers are aimed. If you’re not, then the perceived differences between the “narrow” and “omni” beam widths will be very different… This is because you’re sitting outside the narrow beam, so, for starters, the direct sound from the loudspeakers in omni mode will be louder than when they’re in narrow mode. In an extreme case, if you’re in “narrow” mode, with the loudspeaker pointing at the wall instead of the listening position, then the reflection will be louder than the direct sound – but now I’m getting pedantic.


Wrapping up…

The idea here is that we’re experimenting on building a loudspeaker that can deliver a narrow beam width so that, if you’re like me – the kind of person who has one chair and no friends, and you know what a “stereo sweet spot” is, then you can sit in that chair and hear the same spatial representation that the recording engineer heard in the recording studio (without having to make changes to your living room’s acoustical treatment). However, if you do happen to have some friends visiting, you have the option of switching over to a wider beam width so that everyone shares a more similar experience. It won’t sound as good (whatever that might mean to you…) in the sweet spot, but it might sound better if you’re somewhere else. Similarly, if you take that to an extreme and have a LOT of friends over, you can use the “omni” beam width and get a more even distribution of background music throughout the room.


For more information on Beam Width Control

Shark Fins and the birth of Beam Width Control

Beam Width Control – A Primer


Post-script

For an outsider’s view, please see the following…

Ny lydteknikk fra Bang & Olufsen” – Lyd & Bilde (Norway)

Stereophile magazine (October 2015, Print edition) did an article on their experiences hearing the prototypes as well.

BeoLab 90: B&O laver banebrydende højttaler” – Lyd & Bilde (Norway)