In the April, 1968 issue of Wireless World, there is a short article titled “P.C.M. Copes with Everything”
It’s interesting reading the 57-year old predictions in here. One has proven to be not-quite-correct:
While 27 levels are quite adequate for telephonic speech, 211 or 212 need to be used for high quality music.
I doubt that anyone today would be convinced that 11- or 12-bit PCM would deserve the classification of “high quality”. Although some of my earliest digital recordings were made on a Sony PCM 2500 DAT machine, with an ADC that was only reliable down to about 12 or 13 bits, I wouldn’t try to pass those off as “high quality” recordings.
But, towards the end of the article, it says:
The closing talk was given by A. H. Reeves, the inventor of p.c.m. Letting his imagination take over, he spoke of a world in the not too distant future where communication links will permit people to carry out many jobs from the comfort of their homes, conferences using closed-circuit television etc. For this, he said, reliable links capable of bit rates of the order of 109 or 1010 bits will be required. Light is the most probable answer.
Impressive that, in 1968, Reeves predicted fibre optic connections to our houses and the ability to sit at home on Teams meetings (or Facetime or Zoom or Skype, or whatever…)
This episode of The Infinite Monkey Cage is worth a listen if you’re interested in the history of recording technologies.
There’s one comment in there by Brian Eno that I COMPLETELY agree with. He mentions that we invented a new word for moving pictures: “movies” to distinguish them from the live equivalent, “plays”. But we never really did this for music… Unless, of course, you distinguish listening to a “concert” from listening to a “recording” – but most of us just say “I’m listening to music”.
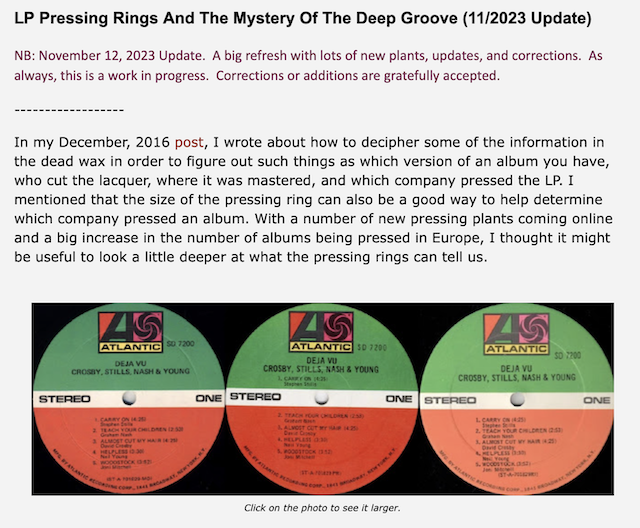
If you have a vinyl record, and you’re curious about where in the world it was pressed, this site might have some information to help you trace its roots.
I had a little time at work today waiting for some visitors to show up and, as I sometimes do, I pulled an old audio book off the shelf and browsed through it. As usually happens when I do this, something interesting caught my eye.
I was reading the AES publication called “The Phonograph and Sound Recording After One-Hundred Years” which was the centennial issue of the Journal of the AES from October / November 1977.
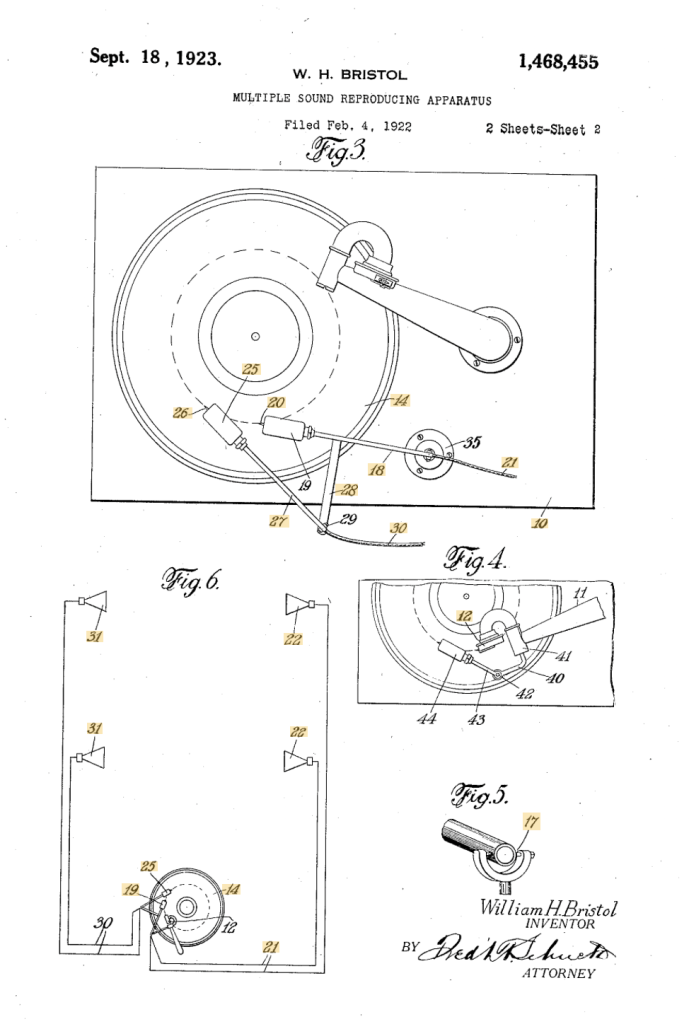
In that issue of the JAES, there is an article called “Record Changers, Turntables, and Tone Arms – A Brief Technical History” by James H. Kogen of Shure Brothers Incorporated, and in that article he mentions US Patent Number 1,468,455 by William H. Bristol of Waterbury, CT, titled “Multiple Sound-Reproducing Apparatus”.
Before I go any further, let’s put the date of this patent in perspective. In 1923, record players existed, but they were wound by hand and ran on clockwork-driven mechanisms. The steel needle was mechanically connected to a diaphragm at the bottom of a horn. There were no electrical parts, since lots of people still didn’t even have electrical wiring in their homes: radios were battery-powered. Yes, electrically-driven loudspeakers existed, but they weren’t something you’d find just anywhere…
In addition, 3- or 2-channel stereo wasn’t invented yet, Blumlein wouldn’t patent a method for encoding two channels on a record until 1931: 8 years in the future…
But, if we look at Bristol’s patent, we see a couple of astonishing things, in my opinion.
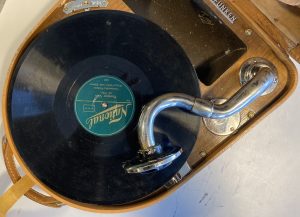
If you look at the top figure, you can see the record, sitting on the gramophone (I will not call it a record player or a turntable…). The needle and diaphragm are connected to the base of the horn (seen on the top right of Figure 3, looking very much like my old Telefunken Lido, shown below.
But, below that, on the bottom of Figure 3 are what looks a modern-ish looking tonearm (item number 18) with a second tonearm connected to it (item number 27). Bristol mentions the pickups on these as “electrical transmitters”: this was “bleeding edge” emerging technology at the time.
So, why two pickups? First a little side-story.
Anyone who works with audio upmixers knows that one of the “tricks” that are used is to derive some signal from the incoming playback, delay it, and then send the result to the rear or “surround” loudspeakers. This is a method that has been around for decades, and is very easy to implement these days, since delaying audio in a digital system is just a matter of putting the signal into a memory and playing it out a little later.
Now look at those two tonearms and their pickups. As the record turns, pickup number 20 in Figure 3 will play the signal first, and then, a little later, the same signal will be played by pickup number 26.
Then if you look at Figure 6, you can see that the first signal gets sent to two loudspeakers on the right of the figure (items number 22) and the second signal gets sent to the “surround” loudspeakers on the left (items number 31).
So, here we have an example of a system that was upmixing a surround playback even before 2-channel stereo was invented.
Mind blown…
NB. If you look at Figure 4, you can see that he thought of making the system compatible with the original needle in the horn. This is more obvious in Figures 1 and 2, shown below.
We attended a concert last week at the Danish Guitar Camp, where Carlo Marchione played a collection of music written for various instruments in the 1700s. One of those pieces was an arrangement of the Adagio from Mozart’s Klaviersonate in B-Major K. 570, which I had never heard before.
As soon as he started, I thought…. waitaminute…. this tune sounds awfully familiar… as a Canadian…
wait… what?
Have a listen to the first 10 seconds of the Mozart, then listen to the first 10 seconds of the Canadian National Anthem. I suspect that Calixa Lavallée might have had the Mozart tune in the back of his head when he sat down to work on Théodore Robitaille’s commission.
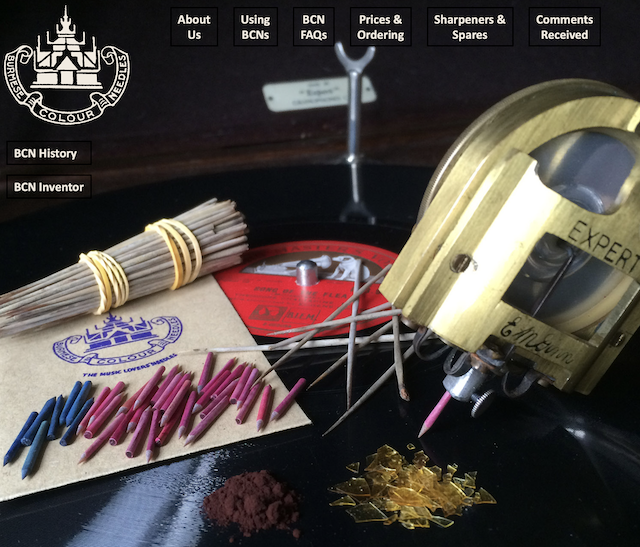
Once-upon-a-time I posted a little thing about Burmese Colour Needles for grammophones. Then, today, I received an email from the owner of www.burmesecolourneedles.com a company owned by Andy Briggs, where you can buy brand new ones!
Andy also has a YouTube channel that is well worth visiting.
Many audio recording systems are based on a concept known as “pre-emphasis” and “de-emphasis”. This is a process where a signal is distorted (here, I use the word “distorted” to mean “changed”, not “clipped”) at the recording or encoding process to counter-act the effects of something that will happen at playback. One example of this is a RIAA equalisation that applies an overall bass-heavy tilt to the frequency response at playback, and therefore the signal is given the opposite tilt when it’s cut onto the vinyl master. Dolby noise reduction for analogue magnetic tape follows a similar philosophy.
Another type of intentional distortion applied to an audio signal is based on assumptions of what happens at playback. Mixing engineers for television often emphasise lower frequency bands, assuming that everyone’s television loudspeakers needed some help. Pop and rock recording engineers check the mix on a low-quality mono loudspeaker and may make adjustments to the mix – to make sure it survived a clock radio or a portable Bluetooth loudspeaker (depending on which decade we’re talking about). Stereo vinyl records can’t have big low-frequency differences in the two audio channels otherwise the needle will hop out of the groove, so they’re mixed and mastered accordingly.
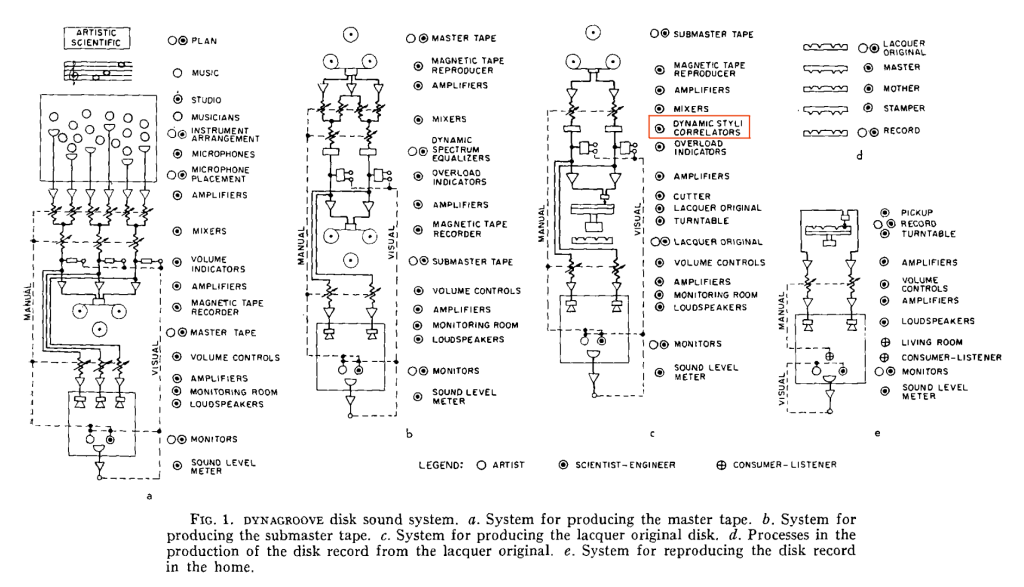
I’ve been reading “The RCA Victor Dynagroove System”, by Harry F. Olsen, published in the April 1964 issue of the Journal of the Audio Engineering Society. In it, he describes the entire recoding chain, including something that piqued my interest called a “Dynamic Styli Correlator” which is a distortion that is applied to the audio at almost the last stage of the signal path before it reaches the cutter head of the lathe that creates the lacquer master. You can see it here in Figure 1 from the article (I drew the red box around it).
Cool name; almost worthy of Dr. Heinz Doofenshmirtz (although it’s missing the “-inator”). But what is it?
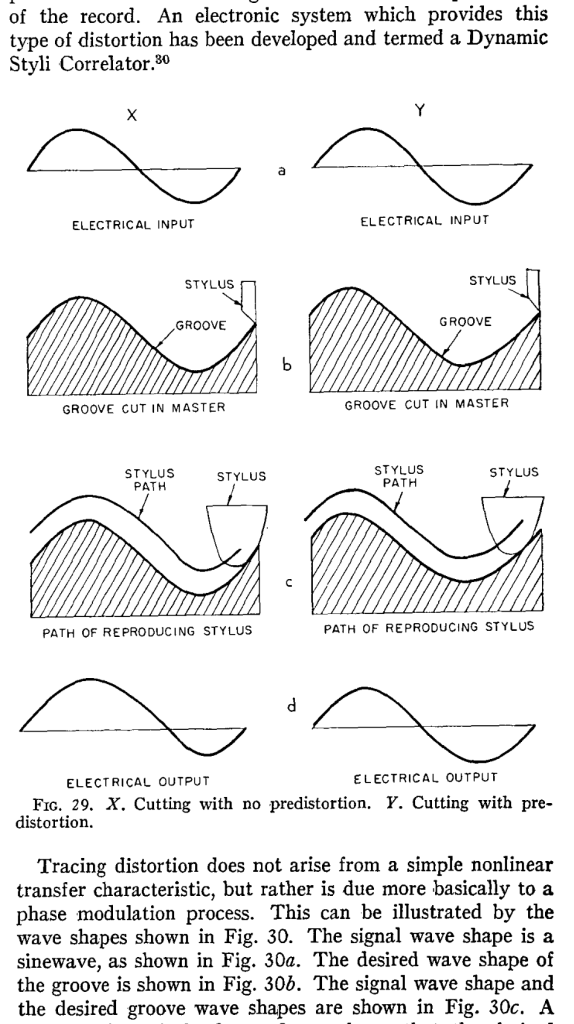
One of the problems with playing back a vinyl record is that the shape of the needle on your turntable is not the same shape as the cutting stylus on the lathe. Consequently, the path that the needle tracks is not exactly the same as the path of the stylus. The result of this mis-match is that the electrical input signal that is used to make the master (the original recording) is not the same as the electrical output signal that comes out of your turntable (what you hear).
The idea behind the Dynamic Styli Correlator was that the actual path of the playback needle could be predicted, and the groove cut by the stylus could be modified to ensure that the output was correct. In other words, the distortion caused by the playback needle was estimated, and a distorted groove was cut to make the needle behave. This is shown graphically in Figure 29 of the article:
This is a great idea if the system works and if the prediction of the playback needle’s path is correctly predicted. However, neither of these two assumptions is guaranteed; so a number of things can go wrong here, and if anything can go wrong, it probably will.
However, it does mean at least as a start, that if you play an old RCA Victor Dynagroove record with a stylus shape that wasn’t invented yet in 1964 (say, a contact line stylus made for CD-4 Quadraphonic records, for example). Then you might wind up doing a much better job of reproducing the distortion that RCA created in the first place, instead of what they thought you were supposed to hear.
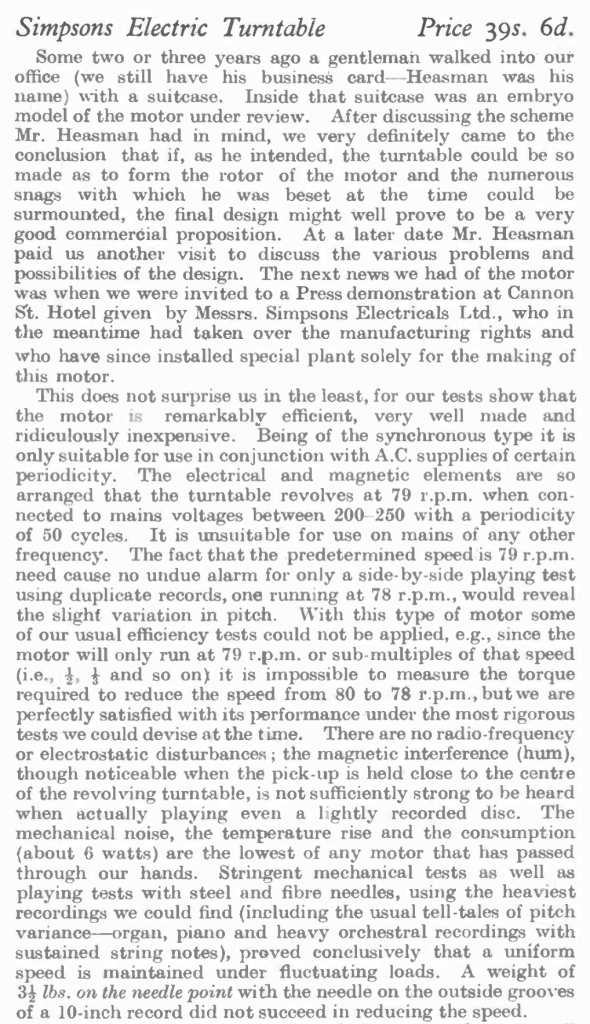
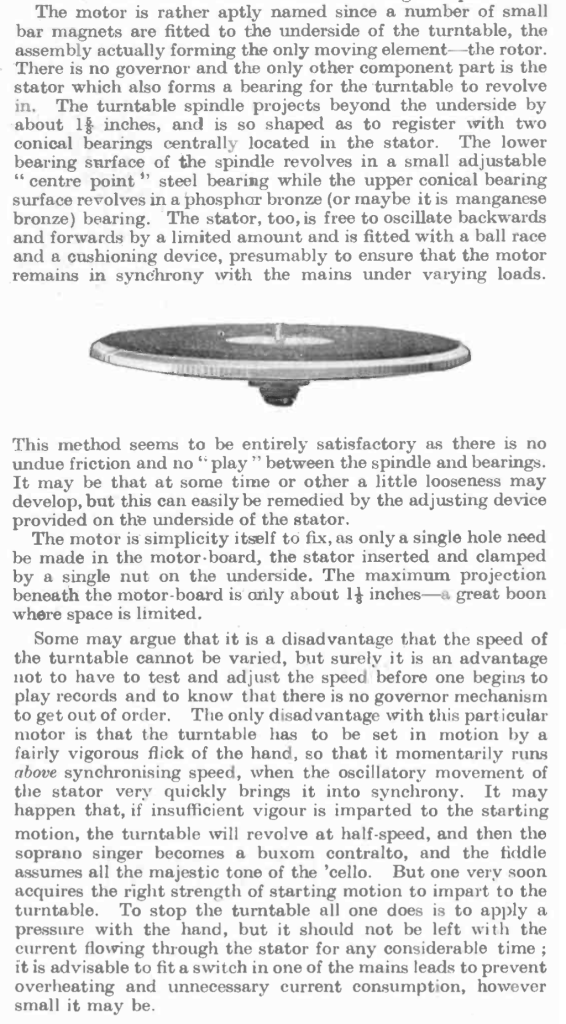
This article, from The Gramophone magazine, August 1932 foretells the future of turntables with platters driven by electric motors. Note that, to test this particular one, they increased what we would today call the “tracking force” to 3.5 pounds (about 1.6 kg) on the outside groove of a 10″ record without reducing the speed. Try that on a turntable today…
Sad to see a familiar mantra here though: “the motor is remarkably efficient, very well made and ridiculously expensive.”
This episode of 99 Percent Invisible tells the story of the Recording Ban of 1942, the impact on the rise of modern jazz music, and the parallels with the debates between artists and today’s streaming services. It’s worth the 50 minutes and 58 seconds it takes to listen to this!
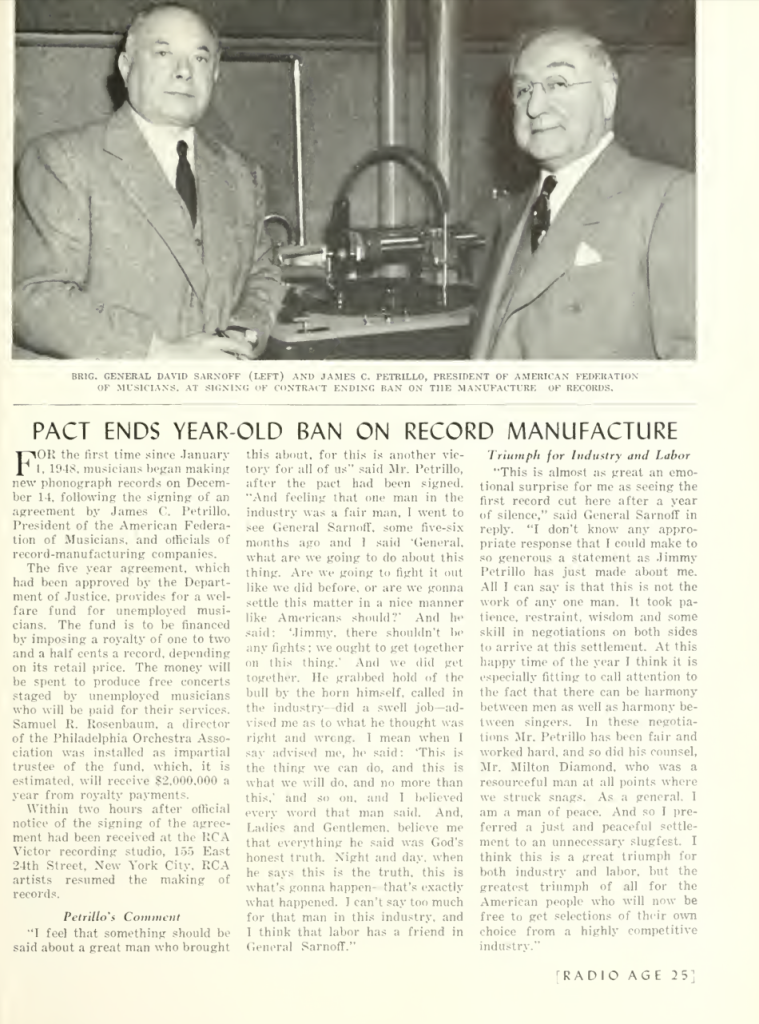
At the end of that episode, the ban on record manufacture is mentioned, almost as an epilogue. This page from the January, 1949 issue of RCA’s “Radio Age” magazine discusses the end of that ban.
Interestingly, that same issue of the magazine has an article that introduces a new recording format: 7-inch records operating at 45 revolutions per minute! The article claims that the new format is “distortion free” and “noise-free”, stating that this “new record and record player climax more than 10 years of research and refinement in this field by RCA.”