#52 in a series of articles about the technology behind Bang & Olufsen loudspeakers
I often have to do demos of loudspeakers for people. Also, I frequently have to make recommendations on how to do (either for Bang & Olufsen dealers, or for things like press events). One of the problems that I face every time I have to do this is how to arrange the chairs so that everyone gets a reasonable impression of how a loudspeaker sounds. The problem is that this is basically impossible, due to the significant influence things like the loudspeakers’ locations, the listener location, and the room, have on the overall sound.
One aspect of how-a-loudspeaker-sounds is its magnitude response (often called a “frequency response”). A (perhaps too-simple) definition of a magnitude response is “a measure of how loud the output signal is at different frequencies if you put in a signal that is the same level at all frequencies”.
If we wanted to make a measurement of a loudspeaker’s magnitude response in a room at a particular position, we just have to put in a signal that contains all frequencies at the same magnitude (or level), capture that output with a microphone somewhere in the room, and compare how loud the signal is at different frequencies. Of course, in order to do this, we have to take care of some details. We have to make sure that the microphone (and everything else in the measurement part of the signal path) has a flat magnitude response. If it doesn’t, then at least we should know what its response is, so we can subtract it from the measurement to remove its influence on the result.
However, for the purposes of this posting, I’m not really interested in the absolute response of a loudspeaker. I’m more interested in how that response changes as you move in a room. Specifically, I want to show how much the magnitude response can change with very small changes in listening position.
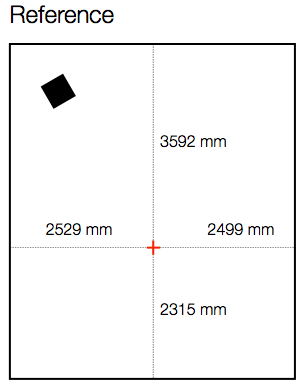
Let’s start by measuring the magnitude response of a loudspeaker in a room at a location. For the purposes of this example, I’ve used a full-range, multi-way loudspeaker without a port. It’s placed roughly 1 m from the side wall and 1 m from the front wall, aimed at a listening position. The listening position is in the centre of the room’s width, and closer to the rear wall than the front wall by about a metre. The details of the location for the microphone (a 1/4″ omnidirectional measurement mic) for this measurement are shown in Figure 1, below.
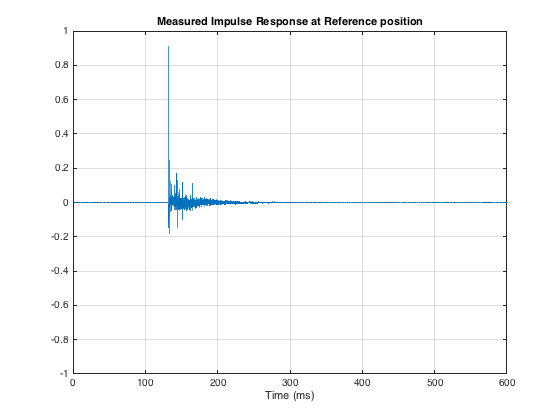
I did an impulse response measurement (using an MLS signal with 4 averages (to improve SNR) and 4 sequences (to reduce the effect of distortion)) of the loudspeaker, the result of which is shown below in Figure 2. As you can see there, there are many obvious reflections after the initial impulse, and there is some kind of ringing in the room’s response.
The extremely long time before the onset of the impulse is arbitrary. The microphone was not actually 40 m away from the loudspeaker…
As I said above, I’m not interested in the resulting magnitude response of this measurement. I can tell you that it’s messy. There are bumps and dips in the low end caused (primarily) by room modes. The top end is messy due to the reflections. The overall curve is not flat due to the loudspeaker’s response, the microphone’s orientation, and various components in the signal path. However, I don’t care, since I’m not here to measure how the speaker behaves at one location in the room. I’m here to find out how its behaviour changes when you change location. So, let’s move the microphone.
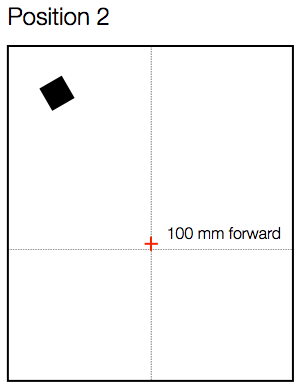
As you can see in Figure 3, below, I started by moving the microphone only 100 mm, directly forwards in the room.
Again, I measured the impulse response, converted that to a magnitude response (reflections and all!), smoothed it with a running 1/3 octave smoothing and subtracted the magnitude response measured at the Reference position (also smoothed to 1/3 octave). The resulting difference is shown in Figure 4, below.
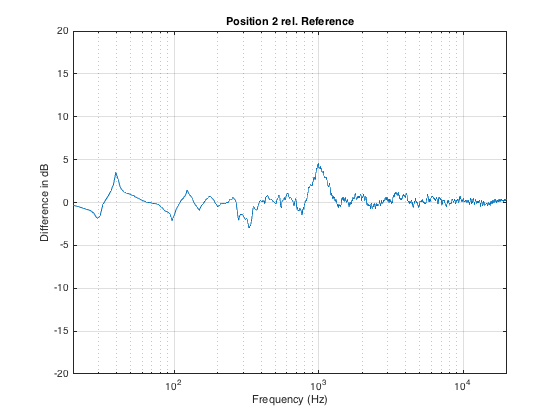
As you can see in Figure 3, moving the listening position only 100 mm results in a magnitude response deviation of about -2 to +4 dB. This is easily within the threshold of audibility for most people…
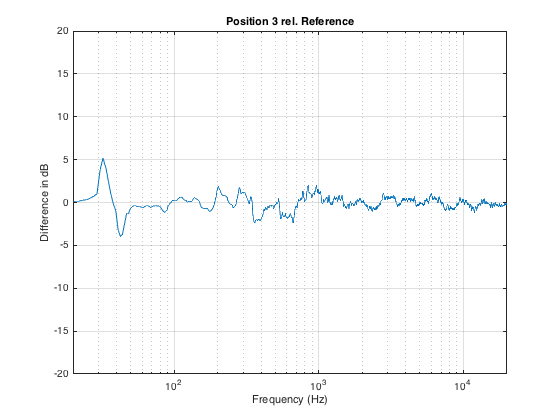
Now, let’s move the microphone sideways instead, as shown in Figure 5.
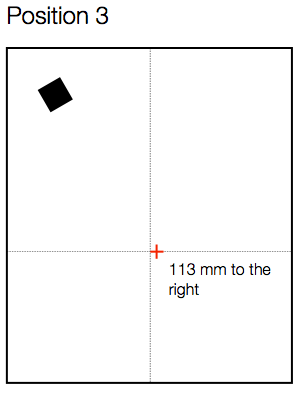
Again, a roughly 100 mm movement results in a large change in the magnitude response – although now the most significant changes have happened in the low end, as can be seen in Figure 6.
If we have more than one listener attending the demo, then I prefer to seat them “bus” style – one directly in front of the other – to ensure that everyone is getting a reasonably good phantom centre image. Sitting off-centre results in the time of arrival of signals from the two loudspeakers being mis-matched which will result in phantom images pulling towards the closer (and therefore earlier) loudspeaker.
Let’s say the we have a person roughly a half-metre behind the “good” chair, as shown in Figure 7. How different is the sound in that location?
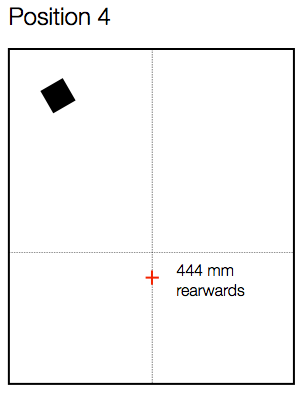
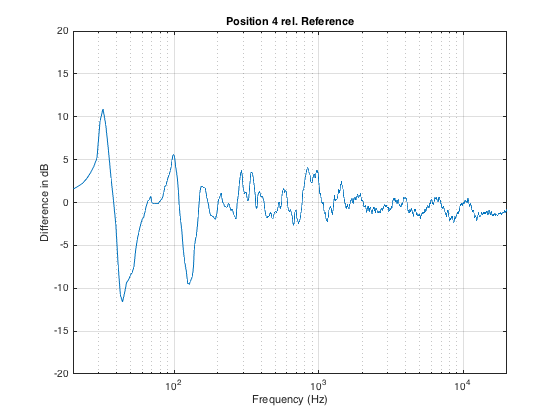
Now we can see in Figure 8 that, by moving backwards in the room, we get more than ± 10 dB of variation in the magnitude response, with significant deviations happening as high as 1 kHz (depending on how you define “significant”).
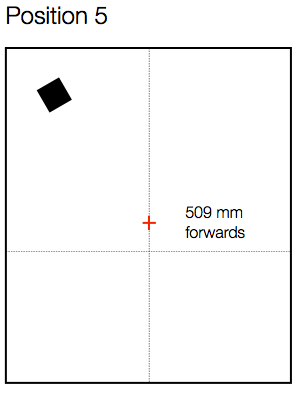
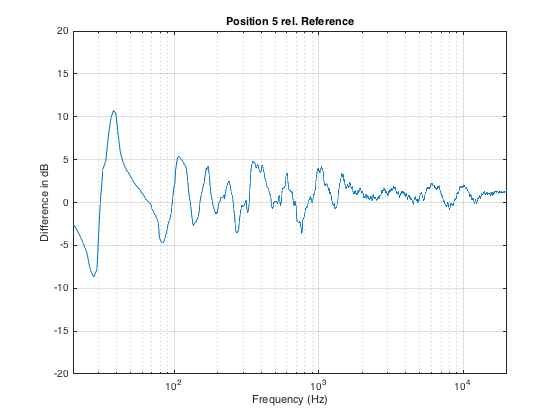
Similarly, moving forwards by a half metre from the Reference position (shown in Figure 9) results in a similar amount of change in the magnitude response, shown in Figure 10.
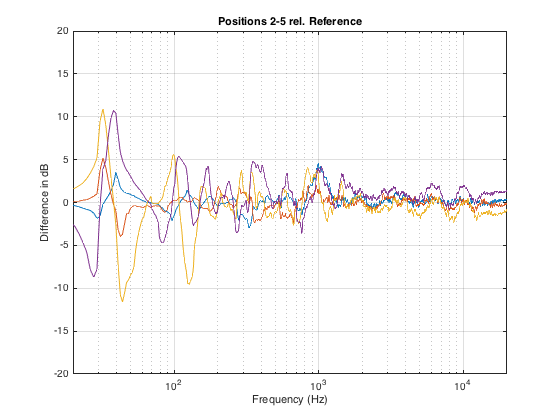
Just for comparison, I’ve re-plotted the 4 magnitude response differences shown above in one plot. This is to show that the changes are not necessarily easily predicable with a simple knowledge of room layout. In other words, it would be almost impossible, without some serious simulation software, to predict these changes just by looking at a floorplan of the room and the chairs.
What’s the moral of the story here? There are many – but I’ll just mention three.
The first is the message that, even a very small change in location (like leaning to one side in your chair – or leaning forwards to rest your elbows on your knees and your chin on your hands) can dramatically change the simple magnitude response of a loudspeaker (we won’t get into the effects on the spatial behaviour of the system).
The second is that, when you’re sitting with a friend, auditioning a pair of loudspeakers, switch chairs now and again. It is extremely unlikely that you’re both hearing the same thing at the same time.
Thirdly, the fact that there are significant differences between magnitude responses at different listening positions (even within a half-metre radius) means that, if you’re doing measurements for a room compensation system using a microphone around the listening position, it’s always smarter to make more than one measurement. In fact, there are some people who argue that, in this case, having only one measurement is worse than having no measurements, since you can easily get distracted by something in the magnitude or the time response that is a problem at only that location and nowhere else.
Finally, it’s worth considering that first point a different way. Let’s say you’re the type of person who likes to tweak a stereo system by upgrading components like wires. And, let’s say that you have incredible powers of “sonic memory” – in other words, you can listen to a system, take a break, listen to it again, and you are able to detect extremely small changes in system performance (like the magnitude response). So, you listen to your system – then you get out of your chair, change the component, sit down again, and start listening to the same tune at the same level. Remember that, unless you are in exactly the same location that you were before (not just “in the same chair”…), it could be that there is a larger difference in the magnitude response of the loudspeaker due your change in position than there is due to the component you just changed… So if you are a tweaker – get someone else to do the dirty work for you so you can sit there, in your chair, with your head in a clamp, waiting to evaluate the “upgrade”…
Johan says:
Would you say that a true omni-radiating speaker show less of the described position sensitivity – measured as well as subjectively?
//
geoff says:
hi Johan,
Actually, I would say the opposite. In my experience, omnidirectional and bi-directional (dipole) sources are the worst-case for being sensitive to loudspeaker position and listener position in the room. This also makes sense intuitively – the more directional a loudspeaker, the less energy its sending into the room, so the less influence there is from reflections and modes.
Your question makes me think that this would be a good topic for a future blog posting – the relationship between a loudspeaker’s directivity and its sensitivity to placement in the room… Thanks!
Cheers
– geoff
Johan says:
My thinking was that the multi diversity/reflection would even out the “fading dips” – but apparently it does not work like this?
//
geoff says:
If you’re smoothing the measurement, and if you have a very reflective room, then your intuition is correct. However, we don’t hear in third-octaves – smoothing is only really useful to make the graphs easier to interpret with our eyes.
Consider an extreme case where your loudspeaker is infinitely directional – like a laser beam. If you’re in the beam, then you hear/measure the sound wave – but there is no influence of the room at all. If you’re outside the beam, there’s no sound to hear.
Cheers
-geoff
Johan says:
OK! What was your measurement integration time? I suppose it matters how long one stays on a particular frequency and take time to integrate all the energy for that frequency. I also suppose that time should be something equal to the brain-ear behavior to get any correlation to what one experience. As long as we can’t separate reflections, durations shorter than that should mean we could do positive use of reflections?
At zero time integration (or near) it will be only direct sound that will be collected by the microphone and room and speaker dispersion behavior will not come into play?
//
geoff says:
For the plots shown here, I did a 32768-point impulse response at 48 kHz, which, for the purposes of this room, is almost long enough to get its entire decay – except for a couple of the bottom modes. If course, it doesn’t make sense to use a 680 ms long impulse response to interpret anything at 10 kHz – which is why I smoothed the plots. When doing things like this, you have to choose how best to mis-interpret the data. :-)
This is also, partly, why I didn’t bother to show the “raw” magnitude responses – only the differences between them. As you point out, what is best is to use different impulse response times for different frequency bands if you want to best represent how one ear will perceive timbral balances.
In addition to this, we also have to consider that I used an omnidirectional microphone to do these measurements – so it is equally sensitive to effects caused by reflections from walls as it is to the floor and ceiling. However, for us humans, this is not true. “Painting with a very wide brush,” we are less sensitive to the effects of side wall reflections on timbre than the effects of vertical reflections. This is because we have ears on the sides of our heads – not on the top and bottom – so we use sidewall reflections, in part, to determine distance. Vertical reflections are just perceived as comb filters…
Another issue to consider is that the relationship between the impulse response length and the smoothing will also be different whether we’re talking about frequency bands above or below the Schroeder Frequency. To some extent this can be seen in the plots above. The biggest differences in the magnitude response measurements that I made are in the low end, since the room I did the measurements in has modal issues (to be polite…). Moving a small amount in that room will cause you to move in and out of a null in the mode – which, in a magnitude response plot, will be seen as a very large change in level.
If I had taken the entire configuration to a larger room – or outdoors, the differences would have been much MUCH smaller. Then again, if the room were smaller, the large differences in magnitude responses would extend to higher frequency bands… As they say in commercials – results may vary…
Cheers
-geoff
Johan says:
Thanks for your explanation. So what is a good architecture on “solution” level?
//
Johan says:
Thanks for your explanation. So what is a good architecture on “solution” level?
Do you prefer to be there or them to be “here”?
//
geoff says:
HI Johan,
I don’t think that I understand your question. If you’re referring to the debate one sometimes reads in “audiophile” discussions regarding whether listening to a recording should give you the impression of being in the performance space (“you are there”) or the musicians are in your listening room (“they are here”) then my very certain answer is “neither!”
In my opinion, the purpose of a playback system in a a listening room is to give the listener the same presentation of the recording that the mastering engineer heard when she/he did the mastering.
This article from 1966 is an excellent one to read if you are interested in the philosophy of how musicians, instruments and acoustic spaces are captured in a recording. However, it’s important to remember that the “they are here” or “you are there” debate is best left to the recording engineer who decides on how the recording itself is done in the first place. It’s not something that should be altered by the final playback system or the listening room.
cheers
-geoff
Johan says:
Many thanks again for your answers – I will read the article!
//
JeanMichelJarre says:
@geoff: sortry ofr my bad English, and sorry if i cannot explain how much i ‘m greateful to all your work.
These articles really RULES !
Many thanks geoff, from an Italian obseessed with B&O since …ages !