#35 in a series of articles about the technology behind Bang & Olufsen loudspeakers
Introduction:
Why do I need to compensate for my room?
Take a look at Figure 1. You’ll see a pair of headphones (BeoPlay H6‘s, if you’re curious…) sitting under a lamp that is lighting them directly. (That lamp is the only light source in the room. I can’t prove it, so you’ll have to trust me on this one…) You can see the headphones because the light is shining on them, right? Well… sort of.

What happens if we put something between the lamp and the headphones? Take a look at Figure 2, which was taken with the same camera, the same lens, the same shutter speed, the same F-stop, and the same ISO (in other words, I’m not playing any tricks on you – I promise…).

Notice that you can still see the headphones, even though there is no direct light shining on them. This probably does not come as a surprise, since there is a mirror next to them – so there is enough light bouncing off the mirror to reflect enough light back to the headphones so that we can still see them. In fact, there’s enough light from the mirror that we can see the shadow caused by the reflected lamp (which is also visible in Figure 1, if you’re paying attention…).
If you don’t believe me, look around the room you’re sitting in right now. You can probably see everything in it – even the things that do not have light shining directly on them (for example, the wall behind an open door, or the floor beneath your feet if you lift them a little…)
Exactly the same is true for sound. Let’s turn the lamp into a loudspeaker and the headphones on the floor into you, in the listening position and send a “click” sound (what we geeks call an “impulse”) out of the loudspeaker. What arrives at the listening position? This is illustrated in Figure 3, which is what we call an “impulse response” – how a room responds to an impulse (a click coming from a loudspeaker).

The top plot in Figure 1 shows the signal that is sent to the input of the loudspeaker. The bottom plot is the signal at the input of the microphone placed at the listening room. If we zoom in on the bottom plot, the result is Figure 4. This makes it much easier to see the direct sound and the reflections as separate components.
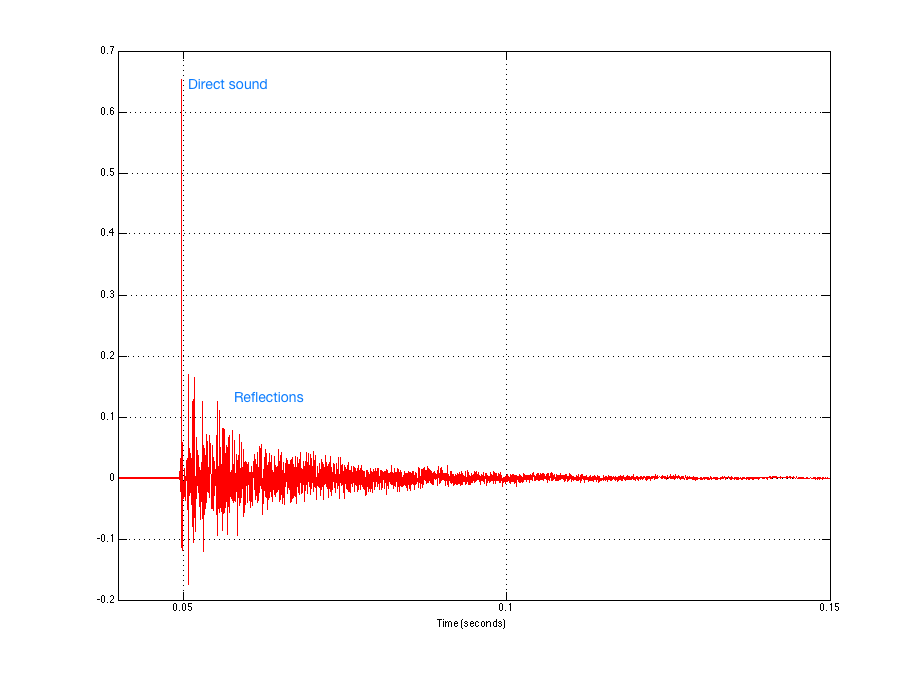
If we zoom in even further to the beginning of the plot in Figure 4, we can see individual reflections in the room’s response, as is shown in Figure 5.

Let’s take the total impulse response and separate the direct sound from the rest. This is shown in Figure 6.

We can then calculate the magnitude responses of the two separate components individually to see what their relative contributions are – shown in Figure 7.

Now, before you get carried away, I have to say up-front that this plot is a little misleading for many reasons – but I’ll only mention two…
The first is that it shows that the direct sound is quieter than the reflected sound in almost all frequency bands, but as you can see in Figure 6, the reflected energy is never actually louder than the direct sound. However, the reflected energy lasts for much longer than the direct sound, which is why the analysis “sees” it as containing more energy – but you don’t hear the decay in the room’s response at the same time when you play a click out of the loudspeaker. Then again, you usually don’t listen to a click – you listen to music, so you’re listening to the end of the room decay on the music that happened a second ago while you’re listening to the middle of the decay on the music that happened a half-second ago while you’re listening to the direct sound of the music that happened just now… So, at any given time, if you’re playing music (assuming that this music was constantly loud – like Metallica, for example…), you’re hearing a lot of energy from the room smearing music from the recent past, compared to the amount of energy in the direct sound which is the most recent thing to come out of the loudspeaker.
The second is in the apparent magnitude response of the direct sound. It appears from the red curve in Figure 7 that this loudspeaker has a response that lacks low frequency energy. This is not actually true – the loudspeaker that I used for this measurement actually has a flat on-axis magnitude response within about 1 dB from well below 20 Hz to well above 20 kHz. However, in order to see that actual response of the loudspeaker, I would have to use a much longer slice of time than the little red spike shown in Figure 6. In other words, the weirdness in the magnitude response is an artefact of the time-slicing of the impulse response. The details of this are complicated, so I won’t bother explaining it in this article – you’ll just have to trust me when I say that that isn’t really the actual response of the loudspeaker in free space…
The “punch line” for all of this is that the room has a significant influence on the perceived sound of the loudspeaker (something I talked about in more detail in this article). The more reflective the surfaces in the room, the more influence it has on the sound. (Also, the more omnidirectional the loudspeaker, the more energy it sends in more directions in the room, which also will mean that the room has more influence on the total sound at the listening position… but there’s more information about that in the article on Beam Width Control.)
So, if the room has a significant influence on the sound of the loudspeaker at the listening position, then it’s smart to want to do something about it. In a best case (and very generally speaking…), we would want to measure the effects that the room has on the overall sound of the loudspeaker and “undo” them. The problem is that we can’t actually undo them without changing the room itself. However, we can make some compensation for some aspects of the effects of the room. For example, one of the obvious things in the blue curve in Figure 7 is that the listening room I did the measurement in has a nasty resonance in the low end (specifically, it’s at about 57 Hz which is the second axial mode for the depth of the room which is about 6 m). It would certainly help the overall sound of the loudspeaker to put in a notch filter at that frequency – in a best case, we should measure the phase response of the room’s resonance and insert a filter that has the opposite phase response. But that’s just the beginning with one mode – there are lots more things to fix…
A short history
Almost all Bang & Olufsen loudspeakers have a switch that allows you to change its magnitude response to compensate for the position of the loudspeaker in the room. This is typically called a Free/Wall/Corner switch, since it’s designed to offset the changes to the timbre of the loudspeaker caused by the closest boundaries. There’s a whole article about this effect and how we make a filter to compensate for it at this link.
In 2002, Bang & Olufsen took this a step further when it introduced the BeoLab 5 which included ABC – Automatic Bass Calibration. This was a system that uses a microphone to measure the effects of the listening room’s acoustical behaviour on the sound of the loudspeaker, and then creates a filter that compensates for those effects in the low frequency band. As a simple example, if your room tends to increase the apparent bass level, then the BeoLab 5’s reduce their bass level by the same amount. This system works very well, but it has some drawbacks. Specifically, ABC is designed to improve the response of the loudspeaker averaged over all locations in the room. However this follows the philosophy first stated Spock said in Star Trek II: The Wrath of Kahn when he said “the needs of the many outweigh the needs of the few, or the one.” In other words, in order to make the averaged response of the loudspeaker better in all locations in the room, it could be that the response at one location in the room (say, the “sweet spot” for example…) gets worse (whatever that might mean…). This philosophy behind ABC makes sense in BeoLab 5, since it is designed as a loudspeaker that has a wide horizontal directivity – meaning it is designed as a loudspeaker for “social” listening, not as a loudspeaker for someone with one chair and no friends… Therefore an improved average room response would “win” in importance over an improved sweet spot.
Active Room Compensation
We are currently working on a taking this concept to a new level with Active Room Compensation. Using an external microphone, we can measure the effects of the room’s acoustical behaviour in different zones in the room and subsequently optimise compensation filters for different situations. For example, in order to duplicate the behaviour of BeoLab 5’s ABC, we just need to use the microphone to measure a number of widely-space locations around the room, thus giving us a total average for the space. However, if we want to create a room compensation filter for a single location – the sweet spot, for example – then we can restrict the locations of the microphone measurements to that area within the room. If we want to have a compensation filter that is pretty good for the whole room, but has emphasis on the sweet spot, we just have to make more measurements in the sweet spot than in the rest of the room. The weighting of importance of different locations in the room can be determined by the number of microphone measurements we do in each location. Of course, this isn’s as simple a procedure as pressing one button, as in ABC on the BeoLab 5, but it has the advantage in the ability to create a compensation filter for a specific location instead of for the whole listening space.
As part of this work, we are developing a new concept in acoustical room compensation: multichannel processing. This means that the loudspeakers not only “see” each other as having an effect on the room – but they help each other to control the room’s acoustical influence. So, if you play music in the left loudspeaker only, then some sound will also come out of the right loudspeaker. This is because both the left and right loudspeakers are working together to control the room (which is being “activated” by sound only from the left loudspeaker.
Millemissen says:
Hi Geoff,
“As part of this work, we are developing a new concept in acoustical room compensation: multichannel processing.”
Wow – looking very much forward to hear the results of this concept :-)
MM