#46 in a series of articles about the technology behind Bang & Olufsen loudspeakers
I’ve been writing and presenting a lot of information over the past couple of months about the general topic of loudspeaker directivity or “Beam Width” as we call it in the BeoLab 90. One thing that I’ve noticed is that, every time I have to do this in person, I have to explain how to read our directivity plots. This has made me realise that these are not necessarily intuitive to someone that doesn’t look at these kinds of plots (or topographic maps) every day. So, I’ve been working on finding different ways to show the same data. This posting is a first attempt – there will probably be others in the future…
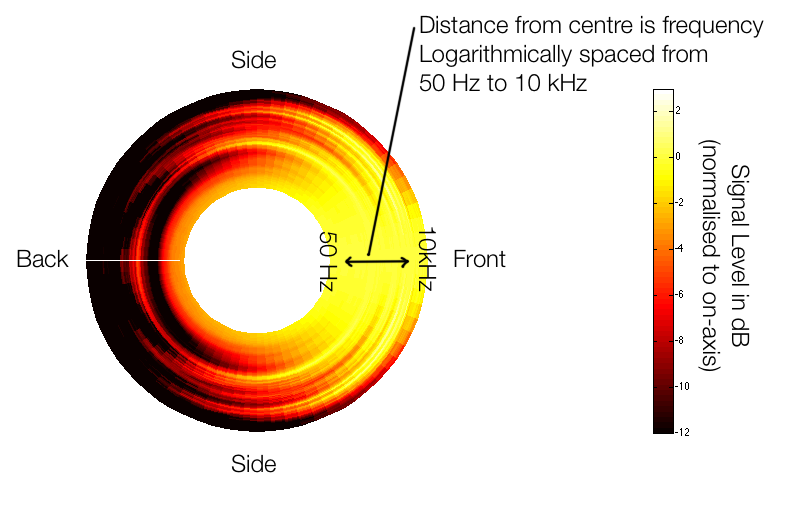
Figure 1, above, shows the idea. We have a loudspeaker, pointing to the right of the screen (towards the word “front”). We measure the magnitude response (more commonly called the “frequency response”) of the loudspeaker on-axis, directly in front of it. Then we rotate the angle of the listening position around the loudspeaker, towards the side. As we do, we measure how much the level changes (usually it gets quieter, but sometimes, at some frequencies and some angles, it gets louder) as a function of angle and frequency. As the angle to the listening position increases, some frequencies will get quiet very quickly, some will not get quiet at all – even when we reach the back of the loudspeaker.
The plot above shows one way to look at this. The inner rings are the low frequencies (in the case of the plots on this webpage, the inner-most ring is 50 Hz) and the further outwards you go, the higher in frequency. The distance between the rings is logarithmic (in other words, by octave) so it makes more sense musically.
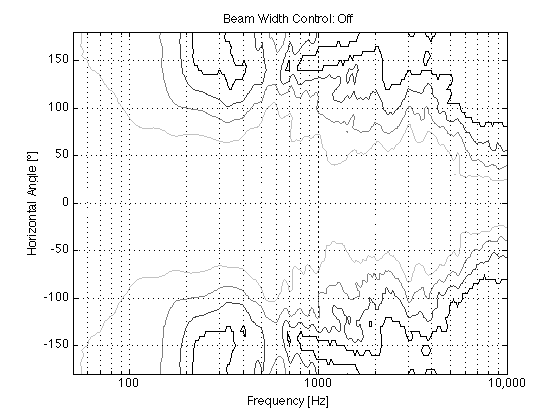
If you’re used to looking at the contour plots that I typically show on this site, then take a look at Figure 2 which shows exactly the same data. In this case, it’s plotted as a contour plot (like a topographic map) showing the -3 dB, -6 dB, -9 dB, and -12 dB contours relative to the on-axis response.
BeoLab 90: Beam Width Control: Off
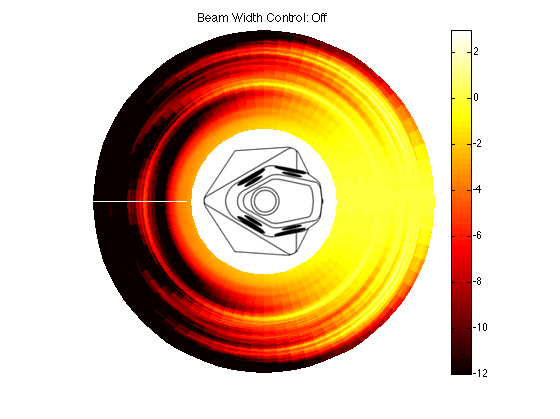
Figures 2 and 3 show the directivity of the BeoLab 90 if you were to disable the Beam Width Control function entirely and just use the front woofer, midrange and tweeter by themselves (and therefore turn off the 15 other loudspeaker drivers in the system. It’s important to note that this is not possible in a production model loudspeaker – we did it as part of the initial measurements of the loudspeaker during the development process.
BeoLab 90: Narrow Beam
As I’ve discussed in other postings, our goal with BeoLab 90’s directivity was two-fold: The first was to have a constant directivity – meaning that it should be the same at all frequencies. The second was that the directivity should be narrow in order to reduce the influence of sidewall reflections. Of course, it should not be too narrow – you don’t want a loudspeaker that you can hear in your left ear, but not your right or “headphones at a distance” as I read on one website.
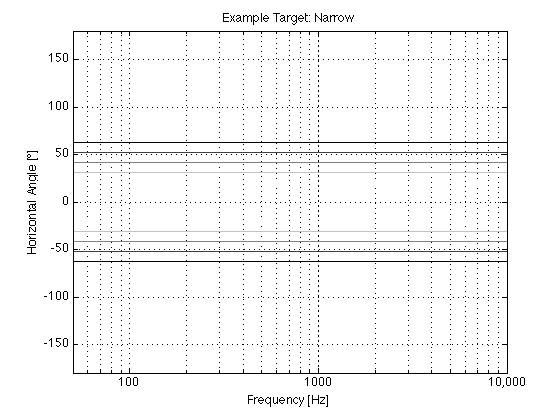
So, we played around with different target directivity functions during the development process, trying to find a beam width that was not too wide and not too narrow. Figures 4 and 5 aren’t drawings of the actual target for BeoLab 90 – but they’re illustrative of the concept.

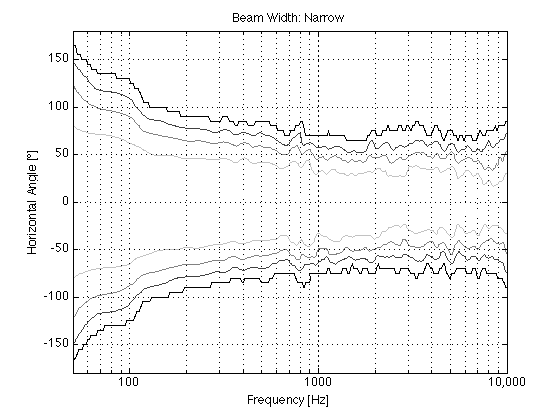
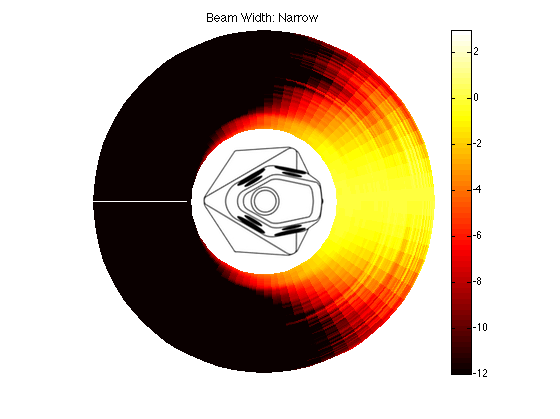
The actual directivity of the narrow beam width in BeoLab 90 is plotted in Figures 6 and 7.
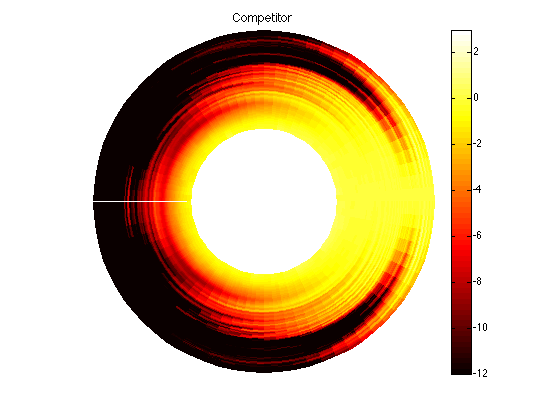
It might also be interesting to compare this to one of BeoLab 90’s competitors from another manufacturer, shown in Figure 8.
BeoLab 90: Wide Beam
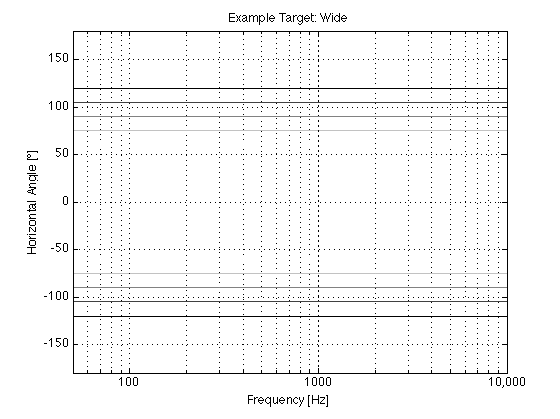
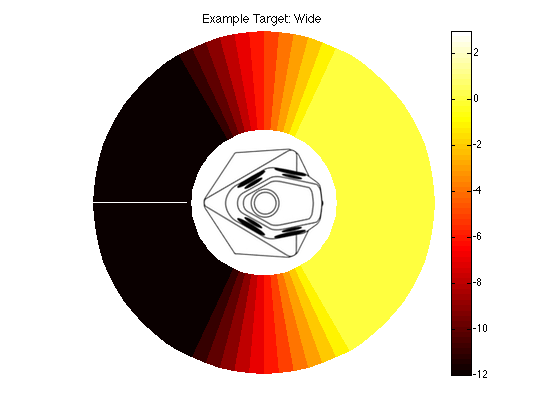
Again, we can look at a candidate for a target (but not the target) for the wide beam mode. This is shown in Figures 8 and 9.
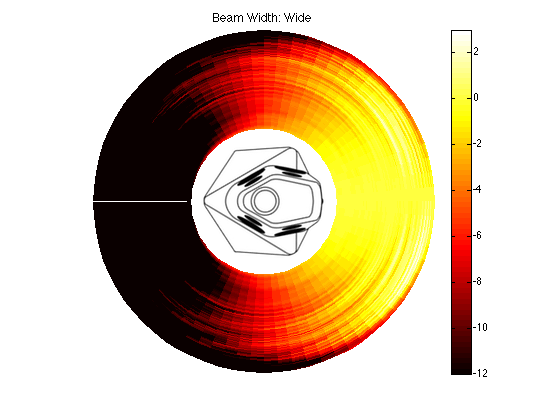
The actual directivity of the wide beam is shown in Figures 10 and 11.
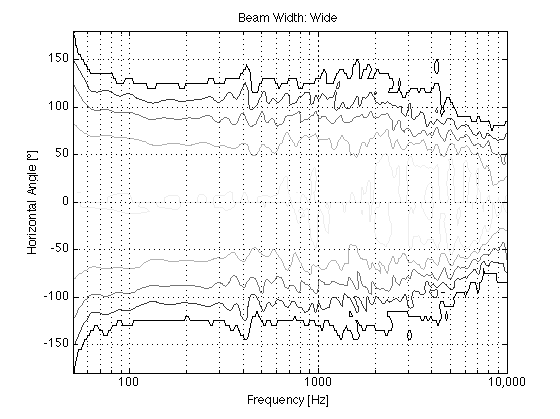
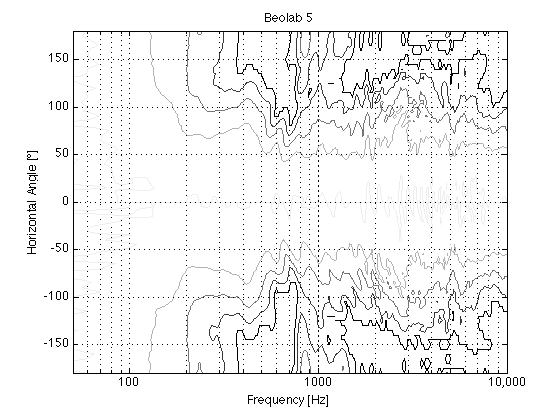
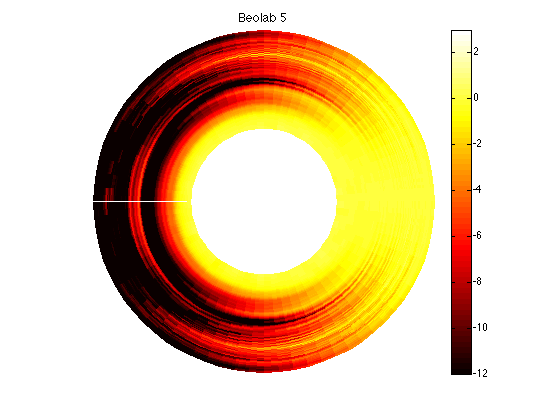
In addition, it might be interesting to compare those plots to the BeoLab 5 directivity, which had similar targets of a constant and wide directivity.
BeoLab 90: Omni Beam
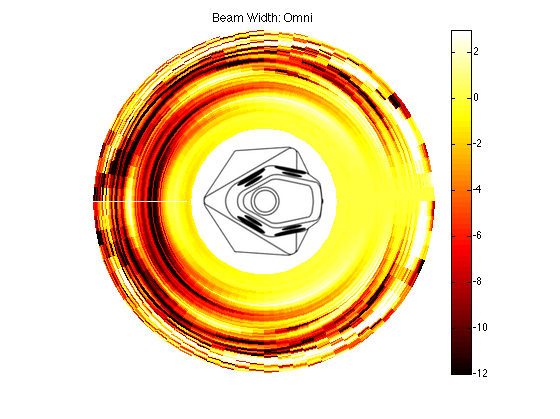
The directivity of BeoLab 90’s Omni mode is shown below in Figures 15 and 16. The lobing caused by the distances between the tweeters is visible in the contour plot, however, as you can see in Figure 16, there is certainly energy being directed in all directions across the entire frequency spectrum. However, the high-frequency lobing, in addition to the beaming in the lower midrange area would indicate that this mode is not appropriate for critical listening…

Some details
The plots above were done in the horizontal plane with a smoothing of 1/12 octave (by semitone).
The measurements on the loudspeakers were done in 73 increments of 5º from -180º to 180º (in other words, we’re actually measuring both sides of the loudspeaker – we don’t just measure one side and assume the directivity is symmetrical.
Christian Klit says:
Hi Geoff,
I didn’t really have a problem reading the others, but I must say that these are much easier to understand, and they look cool! :)
Gary Eickmeier says:
What would the directivity plot of a live orchestra be? I mean if you could slice it in half, take each half to your lab and plunk it down and go around it and measure it, what would you get?
Gary Eickmeier
geoff says:
Hi Gary,
This paper is an excellent place to start when digging into the frequency-dependent spatial behaviour of various instruments. However, the directivity patterns of specific examples of musical instruments have been measured and publised for decades, as is pointed out in the opening paragraphs of the paper.
This is excellent information for beginning tonmeisters who are trying to learn the relationship between instruments, sculpting timbre, and microphone placement. I know that the work by Rossing certainly helped me when I was getting started.
Cheers
-geoff
Gary Eickmeier says:
Thanks for that – superb reference for individual instruments that I had not seen. This concept of auralization is another interesting branch of study. As I understand it, we can take a plot of a proposed new hall and place loudspeakers within it on computer and see what the coverage might be, given those speakers’ directional characteristics and the acoustics of the room.
My Image Model Theory for stereo is a first order variant of such a process, seeing the reproduction as an auralization model of how the orchestra puts sound into the room and mimicking that for the playback. It sees the orchestra as putting out sound in all directions, the first reflections taking on a certain “shape” or pattern off the front and side walls of the concert hall, and the direct sound component diminishing as you go back beyond the critical distance. The speakers must be placed so that all actual and virtual sources are equidistant from each other, so I use 1/4 of the room width in from the side walls and an equal amount out from the front wall. More sound is cast to the rear of the speaker by about 6 dB at certain angles to “light up” the virtual sources and get a small image shift toward the reflecting surfaces. This in turn causes an aerial image to form in a plane behind the actual speakers and wider than the speakers. The speakers disappear and you get the spaciousness and depth that have been recorded coming out on playback. I use specular reflectivity for the walls near the speakers because the early reflected sound focuses too.
My complaint about speaker design is that most all of them cast most of their sound toward the front of the speaker box, under some mistaken theory that all we want to hear is the direct sound, contrary to what we know about how orchestras put sound into the live sound room. The mistaken theory sees the function of the speakers as piping “signals” to the ears, whereas my theory sees the process as projecting sound fields into rooms in the same way live sound does. I am doing just that, and it works and works well.
Gary Eickmeier