Typically, when you read a review of a loudspeaker, you’ll often see a graph that shows a measurement of its “frequency response”. This is a measurement of how loud the loudspeaker is at different frequencies at one position, directly in front of it, if you feed the same signal level into the input of the loudspeaker, and you are not in a room with reflecting surfaces. Usually a measurement like this is done by placing a microphone 1 m in front of the tweeter and putting some special signal (like a sine wave with a changing frequency or something called an MLS signal) into it. In (some persons’ ) theory, the goal of a loudspeaker is to have exactly the same output level at all frequencies (assuming that all those frequencies went into it at the same input level). In other words, output equals input.
However, that’s only a very small view of reality. For starters, this measurement is only done at one signal level. There is no guarantee that the loudspeaker will behave the same way if you measured it with a louder (or a quieter) signal. However, for the purposes of this discussion, we’ll take issue with another point. One big problem with this measurement is that it only tells you how the loudspeaker behaves at one point in space – and this is simply not enough information.
In reality, sound does not beam out of the front of a loudspeaker like a laser beam. The truth is that sound comes out of the loudspeaker and heads in all directions – left, right, up, and down. So, one question to ask is “what’s the difference in the sound that goes out the front, and the sound that goes out the side or the back?” Well, generally speaking – and this is VERY general – there is less and less energy in the high frequencies as you come around to the back of the loudspeaker. There are physical reasons for this that we’ll talk about later (or you could go look it up now, if you prefer) but we won’t get into it here.
So, let’s take a very simplified example:
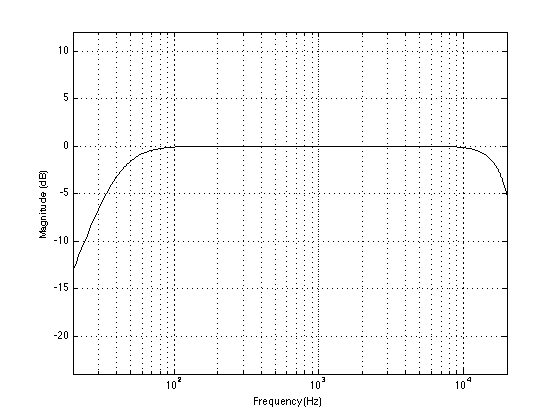
Let’s say that the plot shown above is a frequency response measurement of a loudspeaker done directly in front of it, “on-axis” to the tweeter, 1 m away. As you can see, it has an unbelievably flat frequency response (I’m faking it…) with a roll-off in the very low end (50 Hz) and the high end (18 kHz). How would the same loudspeaker measure if we were to put the microphone at the same distance, but directly to one side, 90° off-axis? Well, it might look something like this:
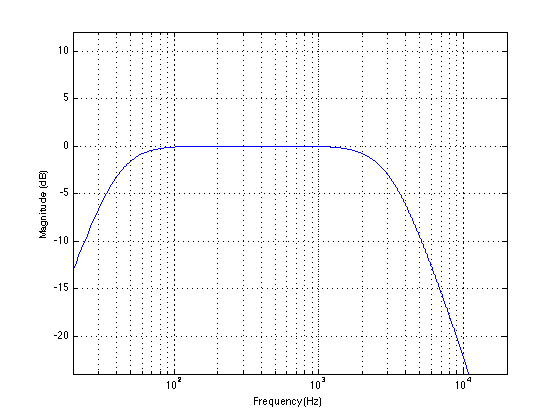
You’ll note here that the low end roll-off hasn’t changed – we have just lost high frequencies. Now let’s measure again, but this time, we’ll put the microphone directly behind the loudspeaker. In this case, we might see a frequency response measurement that look something like this:

So you can see there that we have the same effect – just more of it.
So, the first moral of the story here can be read two different ways:
Option 1: The further around the back of the speaker you go, the less high frequency information you’ll get – or at least, the quieter the high frequencies will be.
Option 2: Bass goes everywhere equally, but high frequencies tend to “beam” forwards.
But there is a different moral to be learned here. Usually, when you buy a lamp to hang on the ceiling to light up a room, you don’t think about how much light is beaming straight out of it, down towards one point on the floor or the wall. Usually, you think about how much light goes out in all directions at the same time – how much it lights up the room (instead of just one location in the room). The same is true for a loudspeaker. We can think about how much energy is coming out of the loudspeaker in all directions at the same time – in other words, how much energy is going out into the room, and not just what’s headed toward your left ear.
In order to consider this, we have to add up the frequency responses of the loudspeaker going out in all directions at the same time. For the purposes of this discussion, we’ll pretend to do only 3 measurements – for the front, side, and back of the loudspeaker – but let’s say that’s enough for now. If we add up the energy in the three frequency responses we saw above, we’ll get something like the one below:
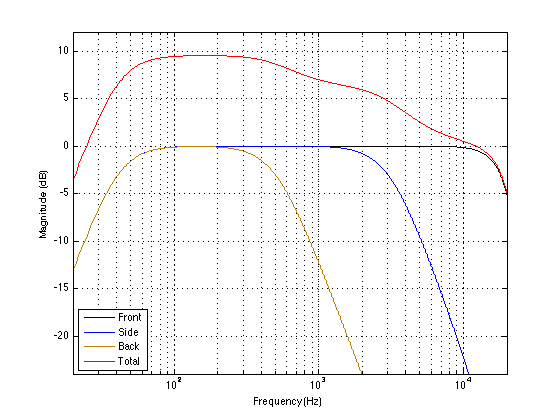
On that plot shown above, you can see the three original measurements, and the result when you add the three of them together (the red curve). In our simplified little world here, what this shows is that, if you consider the sound coming out of the loudspeaker in all directions at the same time (the red curve) you can see that there is more energy in the low frequencies than the high frequencies. So, if we normalised the two measurements (in other words, make them comparably loud (in other words, align them vertically on the graph)) and compare them directly, we see the plot show below, which shows that the power response is generally more bass-y than the frequency response.
So what? Well, if you turn on the music in the living room, and you head into the kitchen to make dinner, you aren’t on-axis to the loudspeakers. So the sound that you’re hearing has very-little-to-nothing to do with the black curve. What’s actually happening is that the sound radiates out of the loudspeaker in all directions at the same time, bounces around the living room and leaks into the kitchen. So, what you’re listening to has much more to do with the red curve than the black curve. If we were being more geeky, we would say that you’re listening to the loudspeaker’s “power response” (because we’re talking about the sum of the total acoustic power put into the living room) instead of its “frequency response”.
That doesn’t necessarily mean that you should try to build a loudspeaker with a flat power response – that’ll sound really bright. However, it might mean that the frequency response curve you see in the magazine review isn’t the only thing that you should worry about… It also means that if you’re building a speaker for people who have more than one chair in the house (or people who have friends), you might want to worry about something more than just the frequency response.
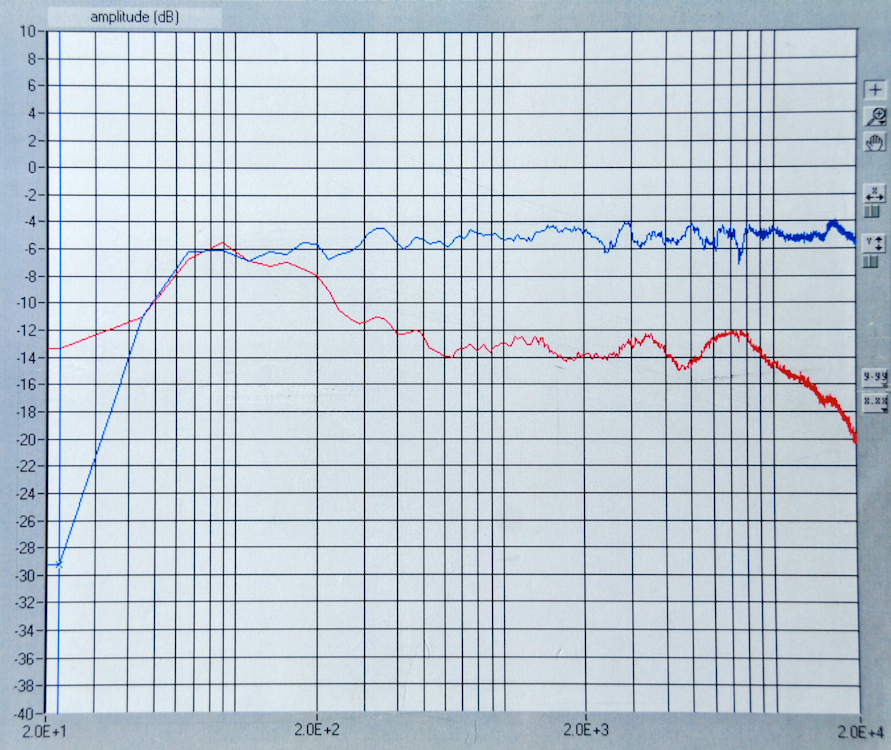
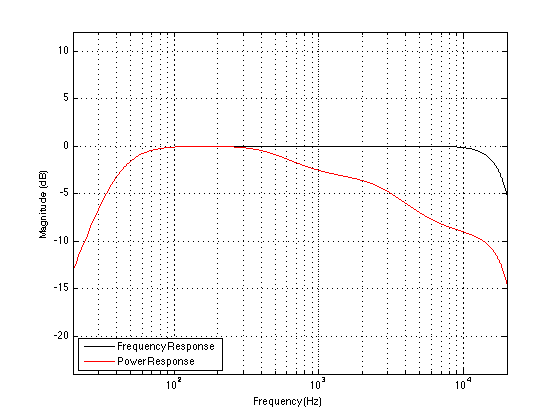
And, just in case you think that I’m oversimplifying too much here, let me prove to you that I’m not. The plots above were built on fake curves, showing what happens when I add only three measurements of a loudspeaker, one in the front, one in the side and one in the back of the device. However, take a look at the curves below. These are two real measurements of a real loudspeaker. The blue curve is the on-axis frequency response measurement (note that this is an active loudspeaker that has been equalised to have a flat-ish on-axis frequency response). The red curve is the measured power response of the same loudspeaker which was found by making a LOT of frequency response measurements around the loudspeaker and summing the results all together to get an idea of what the device was doing in all three dimensions. Looks pretty similar to the fake plot above, doesn’t it?