Let’s build a ported box and put a woofer in it. If we measure the magnitude responses of the individual outputs of the driver and the port as well as the total output of the entire loudspeaker, they might look like the three curves shown in Figure 1.

If you take a look at the curves at 1 kHz, you can see that the total output (the blue curve) is the same as the woofer’s output (the red curve) because the port’s output (the yellow curve) is so low that it’s not contributing anything.
As we come down in frequency, we see the output of the port coming up and the output of the driver coming down. At around 20 Hz, the port reaches its maximum output and the woofer reaches its minimum as a result. In fact that woofer’s output is about 15 dB lower than the port’s at that frequency.
As we go farther down in frequency, we can see that the woofer comes up and then starts to drop again, but the port just drops in level the lower we go.
Now look at the total output (the blue curve) from 20 Hz and down. Notice that the total output of the system from 20 Hz down to about 15 Hz is LOWER than the output of the port alone. As you go below about 15 Hz, you can see that the total output is lower than either the woofer or the port.
This means that the port and the woofer are cancelling each other, just like I described in the previous part in this series. This can be seen when we look at their respective phase responses, shown in the middle plot in Figure 2. I’ve also plotted the difference in the woofer and the port phase responses in the bottom plot.
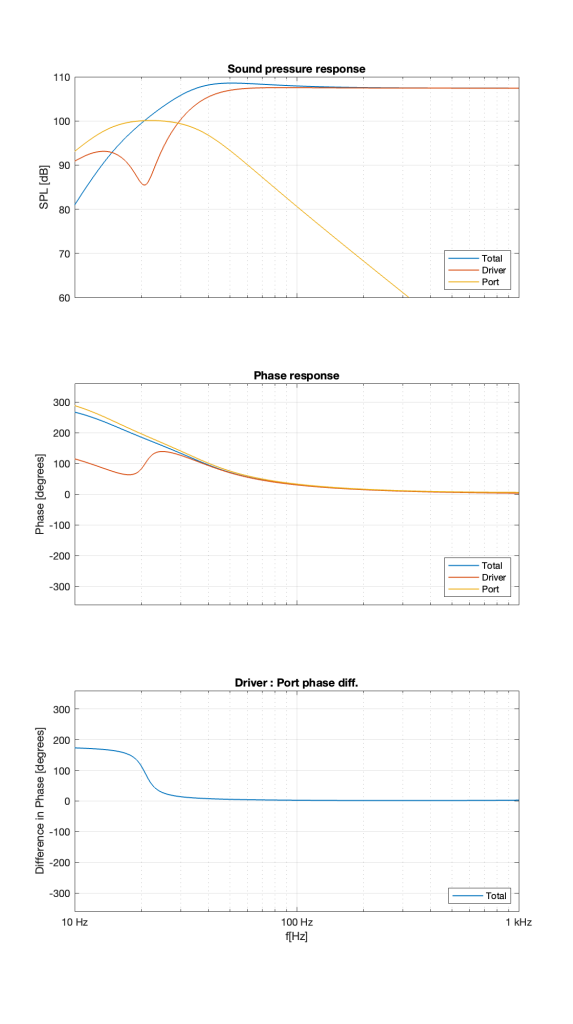
Notice that, below 20 Hz, the woofer and the port are about 180º apart. So, as the woofer moves out of the enclosure, the air in the port moves inwards, and the total sum is less than either of the two individual outputs.
What happens when you put a woofer in a sealed enclosure instead of one with a port? The responses from this kind of system are shown below in Figure 3.

The first thing that you’ll notice in the plots in Figure 3 is that there is only one curve in each graph. This is because the total output is the driver output.
You’ll also notice in the top plot that a woofer in a cabinet acts as a second-order high-pass filter because the cabinet is not too small for the driver. If the cabinet were smaller, then you’d see a peak in the response, but let’s say that I’m not that dumb…
Because it’s a second-order high-pass filter, it has a phase response that approaches 180º as you go down in frequency.
Now, compare that phase response in the low end of Figure 3 to the phase response of the low end in Figure 2. This is where we’re headed, since the purpose of all of this discussion is to talk about what happens when you have a system that combines sealed enclosures with ported ones. That brings us to Part 6.