http://www.opengoldbergvariations.org
I wish I had done this.
I recently was interviewed by cycling74.com to talk about how I use Max/MSP when I’m doing the sound design for loudspeakers at Bang & Olufsen. I used part of the interview to “complain” gently about the fact that the filtergraph~ object in Max uses Robert Bristow-Johnson’s definition of “Q” without being explicit in stating that it does. (Don’t get me wrong here – I have no issues with RB-J’s definition – I just want to know what I’m using without having to find out for myself…)
Following the interview’s publication on the website, there was a discussion that ensued about this issue. So, I decided to put my money where my mouth is and to find out for sure what the filtergraph~ object is doing.
I could have done this by analysing the 5 coefficients that come out of the object. I decided not to do this – but to actually run an impulse through a biquad~ object to look at the whole filtergraph~ + biquad~ system. So, the patcher I put together to do the analysis looked like this

Admittedly, it’s a bit quick-and-dirty, but it does the job. If you’re wondering, the only reason the /~ 16 object is there is to make sure I don’t clip the sfrecord~ object.
I kept the centre frequency (fc) at 1 kHz and then did 24 combinations of 6 gains (0.0625, 0.25, 0.5, 2, 4, and 16) and 4 Q’s (1, 2, 4, 16), each producing a single impulse response that I imported into Matlab for analysis.
So, the first question to answer is a rather simple one: Is the filtergraph~ object producing reciprocal peak/dip or constant Q filters when you set its type to “peaknotch”? We can quickly figure this out by putting two filters in series with reciprocal gains and identical centre frequencies and Q’s and looking at the output. Instead, I’ll just put up a plot.

This plot shows 6 filter settings, all with fc=1 kHz and Q = 1. The linear gains are 0.0625, 0.25, 0.5, 2, 4, and 16. As you can see there, the filters with gains of 0.0625 and 16 (or -24 and +24 dB) are symmetrical. Therefore, we can reasonably conclude that we’re using reciprocal peak/dip filters and not constant Q.
Now to the meaty stuff. The question then is “exactly how is Q defined?” If you stay away from definitions of Q that involve damping or the S plane (see here), and we stick with the definitions that people who make filters use (i.e. see here as an example), then there are (kind of) seven different, but typical definitions of Q for a peaking filter. (Yes – SEVEN!) This is not because there are seven different equations for calculating Q. Q is calculated by dividing the frequency of the maximum of the peak in the magnitude response over the bandwidth of the boosted frequency band of the signal. (more simply expressed as Q = fc / bw). The problem is that the bandwidth is defined differently by different people, and therefore has different implementation in different gear.
If the frequency band being affected is a boost, then you have three possible definitions of bandwidth:
If the frequency band being affected is a cut, then you have four possible definitions.
So, we have 3 options if the band is boosted, and 4 options if it’s a cut.
Enough of the back-story. Let’s look at how the filtergraph~ object behaves.
As I said, I set the fc to 1 kHz and did impulse response of the 24 combinations of 6 gains and 4 Q’s. I then converted the impulse responses to magnitude responses with 2^17-point FFT’s (giving me a frequency resolution of <1 Hz, since I did the impulse responses at 44.1 kHz). I then found out the Q of the results, using two definitions (the gain-midpoint, and the -3.01 dB definitions) of each. And the results are as follows:
| Linear Gain | MSP Q | Midpoint gain Q | -3.01 dB Q |
| 0.0625 | 1 | 1.0 | 1.0 |
| 0.25 | 1 | 1.0 | 0.5 |
| 0.5 | 1 | 1.0 | 0.3 |
| 2 | 1 | 1.0 | 1.0 |
| 4 | 1 | 1.0 | 1.9 |
| 16 | 1 | 1.0 | 4.0 |
| 0.0625 | 2 | 2.0 | 0.5 |
| 0.25 | 2 | 2.0 | 1.1 |
| 0.5 | 2 | 2.0 | 2.0 |
| 2 | 2 | 2.0 | 2.0 |
| 4 | 2 | 2.0 | 3.8 |
| 16 | 2 | 2.0 | 8.0 |
| 0.0625 | 4 | 4.0 | 1.0 |
| 0.25 | 4 | 4.0 | 2.1 |
| 0.5 | 4 | 4.0 | 4.0 |
| 2 | 4 | 4.0 | 4.0 |
| 4 | 4 | 4.0 | 7.5 |
| 16 | 4 | 4.0 | 16.1 |
| 0.0625 | 16 | 15.9 | 4.0 |
| 0.25 | 16 | 15.9 | 8.5 |
| 0.5 | 16 | 15.9 | 15.9 |
| 2 | 16 | 16.2 | 16.2 |
| 4 | 16 | 16.2 | 30.3 |
| 16 | 16 | 16.2 | 66.0 |
There are a few things to mention here:
N.B. If you need to convert from one system to another, I’ve described how to do this in this posting.
So, you just bought a subwoofer and it has a bunch of controls on it with some familiar names like “level” or “gain”, some sort-of-familiar ones like “cutoff frequency” and “phase” (or, more correctly “polarity” or maybe a switch that says “invert”), and possibly a really unfamiliar knob that says “phase” or “all pass” that goes from a low number to a high number (maybe).
What do all of these controls do, and how do you adjust them?
Well, let’s start with a simple system. We have one subwoofer, one main loudspeaker (let’s say, the left front one) and a “crossover” that divides the energy in the frequency bands appropriately and correctly (in other words, it splits up the bass and the mid/treble and sends the lower stuff to the sub and the upper stuff to the main loudspeaker). Let’s also start with a situation where the subwoofer and the main loudspeaker are the same distance from you, the listener. They’re both set to the correct gain. Everything else in the system is perfect, and you are outdoors (that way, there are no nasty room acoustics to screw us up).
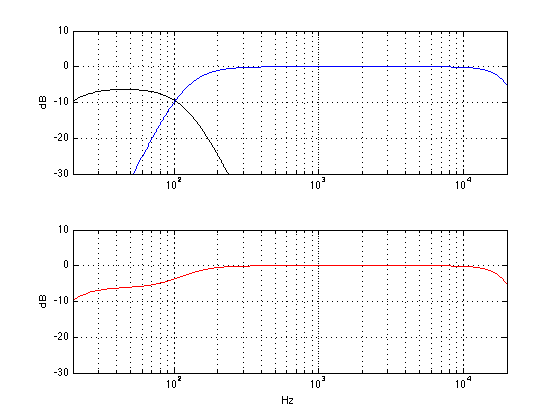
The result of all of this, at the listening position, will be something like the figure below. The black curve shows the output of the subwoofer. (I’ve limited its output to 120 Hz – a typical value – but as you can see, it has lots of output above 120 Hz – it just gets lower and lower in level as you go higher and higher in frequency.) The blue curve shows the output of the main loudspeaker, with a lower limit of 120 Hz. The red curve shows the result of the two of the curves being added together. Note that I have not just added the black and the blue curves. I have actually added the two outputs plotted the result as a frequency response.
Now, let’s change one little thing. We’ll leave everything untouched except for the GAIN (or LEVEL or VOLUME) knob on the subwoofer. Let’s start by turning that up by 6 dB. This means that you now have twice as much sound pressure from the subwoofer. The result will not come a a surprise. As you can see in the red graph below, you get more bass. In fact, you get 6 dB more bass. So, if you like more bass (and you don’t have neighbours), then this is a good idea.
Similarly, we can leave everything untouched except for the GAIN (or LEVEL or VOLUME) knob on the subwoofer and turning it down by 6 dB. This means that you now have half as much sound pressure from the subwoofer. As you can see in the red graph below, you get less bass. In fact, you get 6 dB less bass. So, if you don’t like more bass (or if you have cranky neighbours or sleeping children), then this is a good idea instead.
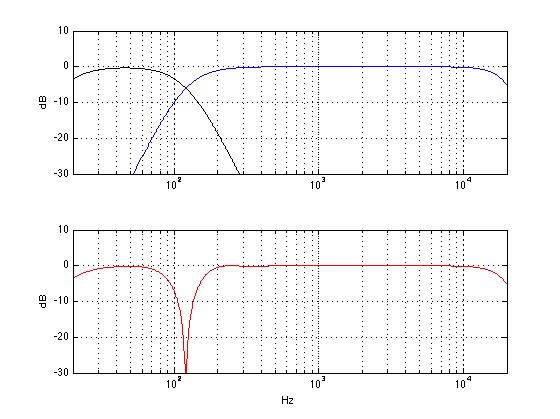
Okay, enough of the easy stuff. Let’s get complicated. Let’s set the gain of the subwoofer back to “correct” and move the subwoofer away a little bit. We’ll start by moving it 1.433 m (that’s about 4′ 8 1/2″ for those of you in the USA…) further away from the listening position than the main loudspeaker (I have chosen this value carefully, but it doesn’t matter how, for the purposes of this discussion…) Now, without fiddling with any of the knobs, what do we get at the listening position? Well, that will look like the figure below.

There are two important things to notice in the plot above. The first thing is that the black and blue curves are identical to the ones in the plot at the top. This means that the individual outputs of the subwoofer and the main loudspeaker have the same frequency content as they did when we started. This should not come as a surprise, since all we did was to move the subwoofer – it should have the same output. The second thing to note is that there is now a big dip in the red curve at 120 Hz. Why is this? Well, it’s because when the two loudspeakers have a difference in distance of 1.433 m, they don’t line up in time. The practical result of this is that, at 120 Hz, both of the loudspeakers “push” air at the same time, and that high pressure in the air starts moving towards you. A little while later, both loudspeakers (which is closer to you) are “pulling” air, making a low pressure in the air. The problem is that, due to the speed of sound being “only” 344 m/s, the amount of time it takes the high pressure to get from the subwoofer to the main loudspeaker (1.433 m away…) is exactly the same amount of time it takes for both speakers to change from “pushing” to “pulling”. So, when the high pressure from the subwoofer passes by the main loudspeaker, the main loudspeaker is creating an equal (but opposite) low pressure. Those two pressures (one high and one low) add together in the air and cancel each other out. As a result, you can think that the output of the main loudspeaker counteracts the output of the subwoofer, and you get less.
The important thing to remember here is that both speakers are working just as hard as they did before – it’s just that you don’t get any output at that one frequency. Note as well that the frequency where the subwoofer and the main loudspeaker cancel each other is dependent on how far apart they are, as we’ll see later.
What does this sound like? Well, you might notice that there are a couple of bass notes (specifically, around the B a little more than an octave below middle C) are much quieter than the other bass notes. Or, you might just experience that you have less bass generally. For those of you who think that “bass” is much lower than 120 Hz, you might experience that the total system loses warmth in the sound (although “warmth” is generally a little above 120 Hz… depending on your tastes…)
So, how do we fix this problem? Well, since we have a problem with high pressures getting cancelled by low pressures, one solution is to “flip” the output of the subwoofer so that it generates a low instead of a high and vice versa. (In other words, we’re telling it to “push” out instead of “pulling” in and vice versa. We can do that by changing the POLARITY or PHASE or Ø switch (those are just different names for the same thing – sort of…) on the subwoofer to NEGATIVE or INVERT. The result of this, at the listening position, is shown below.

As you can see in that plot above, the result isn’t perfect, but it’s a lot better. The deep notch that we had at 120 Hz is gone, and now all we have is a little ripple around the “crossover region” where the outputs of the two loudspeakers overlap.
There are some people who think that there is an audible difference between the sound of a kick drum “pushing” a loudspeaker out (and making a high pressure) and “pulling” a loudspeaker in (and making a low pressure) and, as a result, they don’t like flipping (or inverting) the polarity of a subwoofer. If you’re that kind of person, and if you have a PHASE or ALLPASS knob on your subwoofer, you have an option. An allpass filter is a special filter that does not change the magnitude (or output level) of the signal, but it does change the phase as a function of frequency. What that means (sort of) is that it can add (or subtract) different delays for different frequencies (I know, I know, it’s not a delay – but if you can think of a better way to describe it to neophytes, be my guest). If we use an all pass filter (for the geeks, I’m using a second-order allpass filter) and set its frequency to 120 Hz and apply that to the subwoofer signal, the result is shown in the plot below.
In other words, if you have a problem like this, and you flip the polarity switch and get those missing bass notes back (or the bass in general – or the warmth), then you’ve probably fixed the problem.

As you can see in that plot above, the result still isn’t perfect. In fact, it’s a little worse than the polarity invert solution – but it’s still a lot better than the problem we’re solving. The deep notch that we had at 120 Hz is gone, and now all we have is a little (but slightly bigger) ripple around the “crossover region” where the outputs of the two loudspeakers overlap.
The reason this particular setting of the allpass filter worked is because I had a 2nd order allpass filter, and I set it to 120 Hz. This meant that the phase “delay” of the allpass filter was the same as the phase “delay” caused by the difference in distance. If I had used an allpass filter with a different order (i.e. a 1st order), and/or a different frequency, and/or a different distance, this would not have worked as well (we’ll see that as an example below…).
So, the moral of the story here is that, if you have the problem caused by distance, and you play with the ALLPASS or PHASE knob, and listen to those missing bass notes, just fiddle with the knob until the bass notes are there…
But what happens if the subwoofer is further away than the main loudspeaker but not as far away as we have been looking at above? Let’s place the subwoofer 0.72 m (2′ 4 1/4″) further away than the main loudspeaker and take a look at the result – shown in the red plot below.

Now you can see that we still have a dip at 120 Hz, but it’s not as bad as when the subwoofer was 1.4 m away. This is because the time alignment of the two loudspeakers is better, the closer together they are.
So, how do we solve this problem? Well, let’s start by flipping the POLARITY switch again. The result of that is shown below.

As you can see in the red plot above, flipping the POLARITY or INVERT switch actually makes the problem worse now that the loudspeakers are closer together. We’re losing more “bass” at 120 Hz because we have flipped the switch. So, we’ll need to find a different solution.
Okay, let’s play with the allpass filter again. We’ll set it to 120 Hz like we did before and take a look at the result (shown below).

Hmmmm… that didn’t work. Not only is the allpass (at 120 Hz) worse than the original problem, it’s also worse than flipping the POLARITY switch (in other words, we’ve lost more bass around 120 Hz – since the dip in the red curve is deeper).
Okay, let’s fiddle with that ALLPASS or PHASE knob a little. we’ll start by turning it lower in frequency, the result of which is shown below.

Hey, that worked well! Although our problem is at 120 Hz, we nearly fixed the problem by setting the allpass filter’s frequency to 40 Hz. Again, a different order of allpass, or a different distance between loudspeakers or a different anything else would have resulted in us finding a different frequency. Do not assume that 40 Hz is the magic number.
Just because I like fiddling with knobs, let’s try going the other way. We’ll turn up the allpass frequency to 240 Hz – the result of which is shown below.
Hmmmm.. .that’s not good. We’ve made the problem much worse. Okay – set it back to 40 Hz (for this example…).
The moral of the story
If you go to a lot of websites, you’ll get the advice that, when setting up a subwoofer, you should put the speakers where you want them, and then fiddle with the switches and knobs so that you get the most bass. This is only partly true. As you can see above, we’re really talking about a frequency band around the “crossover region” where the signals are coming from both the subwoofer and the main loudspeakers.
In a perfect world, the subwoofer has characteristics that perfectly match the main loudspeakers, and you’ve put all of them the same distance from the listening position. This is rarely true. So, you’ll have to fiddle with something to clean up the resulting mess. However, if you just listen for “bass” you might be distracted away from where the real problem lies. Instead, set up your system and listen to the bass line (i.e. the notes played by the instrument called the bass – I don’t care if it’s electric or acoustic. If you prefer ‘celli, you can use them instead). If you notice that some notes are much quieter, you have a problem that you might be able to fix by fiddling with the subwoofer’s controls. Take them one at a time, and listen to those notes that you lost before. If you get them back, you’ve fixed the problem. If you fiddle with every knob, and you can’t get those notes, you might need to blame the musicians or the recording engineer… In fact, it will have to be their fault, because if it’s not, it might be your room, and fixing that is expensive.
I was the final sound designer for the A9, so my job was deciding on its final tonal balance.
Tim Gideon of PCMag.com wrote in this review:
“The bass is intense without being over-the-top, as the system seems to primarily focus on high-mids and highs. The A9 is a crisp, bright system, balanced out by powerful low-end, for sure, but it is the higher frequencies that own the stage.”
Trusted Reviews wrote in this review:
“B&O has opted for a relatively neutral signature, but bass, mid and high frequencies all shine through with the A9 managing that difficult balancing act of tying accuracy and emotion.”
Nick Rego at tbreak.com wrote in this review:
“After all this though, how does the A9 sound? In a word, mesmerizing. The sheer power that the A9 can deliver is absolutely incredible, and if placed in a well furnished room it could be hard to figure out where this incredible sound is coming from. I decided to put the A9 to the ultimate test for a house party I was having in my back garden. I had positioned the A9 towards the top end of the garden path, and when I turned up the volume the music could be heard in almost every corner. There was no distortion at all on the music even when I cranked the A9 up as high as it could go (without waking up half the neighborhood). The A9 certainly delivers on B&O’s promise of sheer audio performance packaged in a sleek enclosure.”

I was part of the development team, and one of the two persons who decided on the final sound design (aka tonal balance) of the B&O H6 headphones. So, I’m happy to share some of the blame for some of the comments (at least on the sound quality) from the reviews.
Audio.de reviewed the H6 paired with an Astell & Kern portable player. They said:
“Tatsächlich aber ertönte der H6 mit dem AK Junior erstaunlich präzise, extrem sauber und stabil und vor allem ungeahnt luftig. Das Zusammenspiel des speziell angefertigten Treibers mit dem ausgeklügelten Bassport stellte nicht etwa – wie oft üblich bei geschlossenen Hörern – die tiefen Frequenzen wummernd und brummend in den Vordergrund. Nein, besonders Stimmen und feine Details profitierten vom knochentrockenen und nicht zu gewaltigen Bass.
“Susanne Sundfos glockenhelle Stimme beispielsweise stand fest gemeißelt im erstaunlich großen Raum, umgeben von jederzeit verfolgbaren Bassdrum-Beats, echten Streichern und Synthesizer-Harmonien. Der kurze Probelauf mit H6 und AK Junior wurde zur ausführlichen Hörsession, die erste Begeisterung zur echten Liebe. Eben true love.”
Correction: That review stated that I said that the H6’s were tuned using the Grado’s as the reference. This is not really true. While we were tuning them, we listened to many different headphones. The Grado’s are one of the many hanging in the listening room…
Gramophone Magazine reviewed the H6 in the April 2014 edition. They said some very nice things about the headphones:
“…excellent clarity and weight, well-defined bass and a sense of openness and space unusual in closed-back headphones. The sound is rich, attractive and ever-so-easy to enjoy.”
and
“… by no means are these headphones designed only for those wanting a pounding bass-line and an exciting overall balance: as already mentioned the bass extension is impressive, but it’s matched with low-end definition and control that’s just as striking, while a smooth midband and airy, but sweet, treble complete the sonic picture.”
and
“As I may have made clear in the past, I haven’t been the greatest fan of headphone listening, much preferring a pair of small speakers on the desk. But with the arrival of fine headphones such as the BeoPlay H6, I’m having to do some re-thinking.”
Bobby Solomon wrote this review at thefoxisblack.com.
“The sound is refined, with the midrange coming through clearly, and the bass and treble are balanced perfectly.”
Kenneth Roberts wrote this review at head-if.org.
“I’d describe B&O’s “house sound” as natural and neutral, with a brilliant, feathery-light high-end that resolves a lot of detail. This describes the H6’s sound perfectly. It delivers a staggering amount of detail in its price-class. In fact, the H6 delivers an impressive amount of detail when compared to headphones well above its price-class! Cymbals, triangles, snares, and hi-hats all sound crisp and light, with nary a hint of sibilance or stridence. I’m guessing this deftly executed high-end lends much to the headphone’s spectacular imaging, which I’ll describe later.”
T3’s website has a review here
“Which rather handily leads us onto how they actually sound. The answer can be summed up with the word ‘balanced’. By this we mean that almost all ranges perform excellently, but never does one take precedence over the other.”
pocketlint.com has their review here
from the middle of the text: “As you might expect, audio quality is top-notch. While we can’t say it competes with some of the other stay-at-home audiophile grade kit, for a set of headphones you can listen to daily, they certainly deliver. Sound is nicely balanced with plenty of detail and not an overly punchy bass. The set of 40mm drivers and the internal bass port just keep everything as clean and simple as possible.”
Tim Gideon and PCMag.com has their review here
The concluding words state: “In the age of big, booming bass, it’s doing its own thing. This is by no means an anemic-sounding headphone pair, it just favors lows, mids, and highs over a wildly boosted sub-bass range. If a more refined, crisp mids-focused sound is what you seek, the H6 will not disappoint, and it’s refreshing to see such a unique sound signature in this field.”
“Bang & Olufsen Finally Got It Right” at head-fi.org
“The sound is surprisingly flat, but a little bit on the warm side. The sound is not as airy as the open back cans, but the soundstage is very good for a portable closed back.”
whathifi.com has a thorough review here
“Based on my favorable impressions of the H6 with the first series of tracks which are heavy on electronic sounds, and also on the second group which feature more conventional bands and acoustic sounds, I’d say the H6 bridges these different genres very well. There are very few headphones that have a decent deep bass response and reasonable impact but don’t have any upper bass emphasis or bloat, and the B&O H6 is one of those few.”
soundandvision.com has a review here
“This is no head-banger headphone, but the bass goes low and it’s nicely articulated. The frequency response is remarkably smooth, without a hint of the rolled highs and boosted bottom common to more mainstream ’phones; the downside to this clarity is that the headphone won’t do anything to blunt the harshness of overcompressed MP3s.”
beforeitsnews.com has a review here
“The sound, however, is near flat and crisp. You’ll be able to hear the fine details of a song or a recording. There’s also no distortion at top volumes, while the midrange is great. Bass is balanced rather than strong, preferring accuracy and refinement to simple power. Think of these headphones as fine wine and other headphones as beers. When you start appreciating its beauty and fine sound, oh boy, where have you been all my life?”
Customer Comments at beoworld.org
There is a long user discussion on the forum here. Persons looking for real-world opinions will certainly get their fill at that site.
“I did not really like the H6 when it was released, a bit thin on an iPhone and a big headphone. And expensive. So I bought the B&W P5 instead. Quite good comfort and good sound. But.. I just had to give the H6 a try so I bought a pair a few days ago (the black model – after a lot of pondering). I now have a completely different feeling about the H6. They sound very natural and good. I like how detailed and precise the sound is. You can hear so many details very well and how acoustic noises changes in frequencies in a wonderful way.”
“My wife has a pair of H6’s in tan, and I am consistently impressed by them.”
“Soundwise, also nice to hear your opinion (and Chris´s). I can’t remember hearing a pair of headphones with a more true sound.”
“I’ve now got a tan pair of my own (240£ for a new pair via eBay) and use them every day. I’ve been listening to some of my favourite music which I’ve listened to for over 40 years on CD, vinyl, digital via an ipod and A8’s and can now pick out musical detail that up to now has eluded me. The separation of instruments on some of my live recordings is incredible, so much so that I’ve found that even Steve Hackett playing live does make some mistakes! None of the music is muddied and I have to say that I don’t find the volume when using an ipod too low. If I want loud music I’ll play it at home on a bigger amp set-up with some bigger speakers. When using the headphones I want the isolation of me and my music.”
Typically, when you read a review of a loudspeaker, you’ll often see a graph that shows a measurement of its “frequency response”. This is a measurement of how loud the loudspeaker is at different frequencies at one position, directly in front of it, if you feed the same signal level into the input of the loudspeaker, and you are not in a room with reflecting surfaces. Usually a measurement like this is done by placing a microphone 1 m in front of the tweeter and putting some special signal (like a sine wave with a changing frequency or something called an MLS signal) into it. In (some persons’ ) theory, the goal of a loudspeaker is to have exactly the same output level at all frequencies (assuming that all those frequencies went into it at the same input level). In other words, output equals input.
However, that’s only a very small view of reality. For starters, this measurement is only done at one signal level. There is no guarantee that the loudspeaker will behave the same way if you measured it with a louder (or a quieter) signal. However, for the purposes of this discussion, we’ll take issue with another point. One big problem with this measurement is that it only tells you how the loudspeaker behaves at one point in space – and this is simply not enough information.
In reality, sound does not beam out of the front of a loudspeaker like a laser beam. The truth is that sound comes out of the loudspeaker and heads in all directions – left, right, up, and down. So, one question to ask is “what’s the difference in the sound that goes out the front, and the sound that goes out the side or the back?” Well, generally speaking – and this is VERY general – there is less and less energy in the high frequencies as you come around to the back of the loudspeaker. There are physical reasons for this that we’ll talk about later (or you could go look it up now, if you prefer) but we won’t get into it here.
So, let’s take a very simplified example:
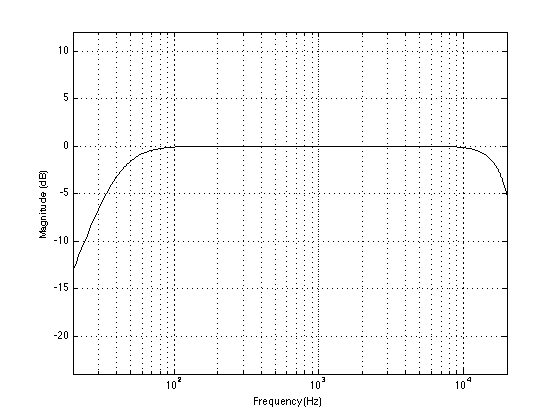
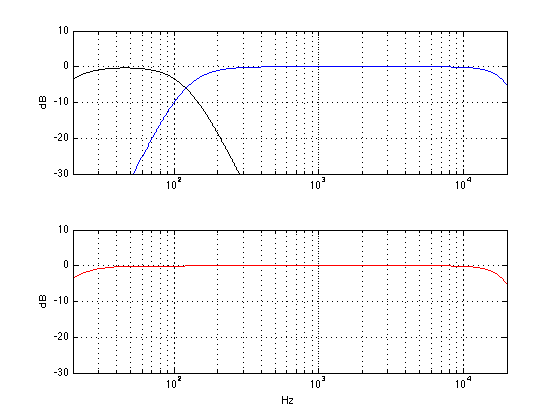
Let’s say that the plot shown above is a frequency response measurement of a loudspeaker done directly in front of it, “on-axis” to the tweeter, 1 m away. As you can see, it has an unbelievably flat frequency response (I’m faking it…) with a roll-off in the very low end (50 Hz) and the high end (18 kHz). How would the same loudspeaker measure if we were to put the microphone at the same distance, but directly to one side, 90° off-axis? Well, it might look something like this:
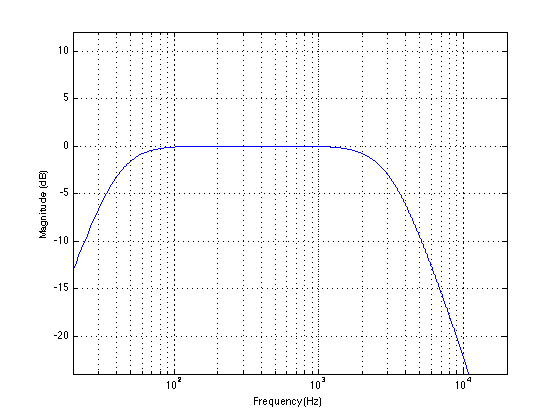
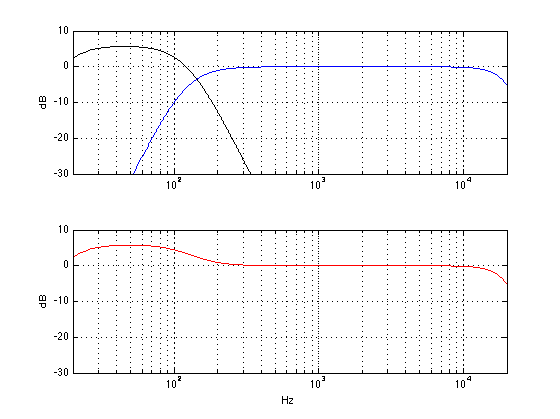
You’ll note here that the low end roll-off hasn’t changed – we have just lost high frequencies. Now let’s measure again, but this time, we’ll put the microphone directly behind the loudspeaker. In this case, we might see a frequency response measurement that look something like this:

So you can see there that we have the same effect – just more of it.
So, the first moral of the story here can be read two different ways:
Option 1: The further around the back of the speaker you go, the less high frequency information you’ll get – or at least, the quieter the high frequencies will be.
Option 2: Bass goes everywhere equally, but high frequencies tend to “beam” forwards.
But there is a different moral to be learned here. Usually, when you buy a lamp to hang on the ceiling to light up a room, you don’t think about how much light is beaming straight out of it, down towards one point on the floor or the wall. Usually, you think about how much light goes out in all directions at the same time – how much it lights up the room (instead of just one location in the room). The same is true for a loudspeaker. We can think about how much energy is coming out of the loudspeaker in all directions at the same time – in other words, how much energy is going out into the room, and not just what’s headed toward your left ear.
In order to consider this, we have to add up the frequency responses of the loudspeaker going out in all directions at the same time. For the purposes of this discussion, we’ll pretend to do only 3 measurements – for the front, side, and back of the loudspeaker – but let’s say that’s enough for now. If we add up the energy in the three frequency responses we saw above, we’ll get something like the one below:
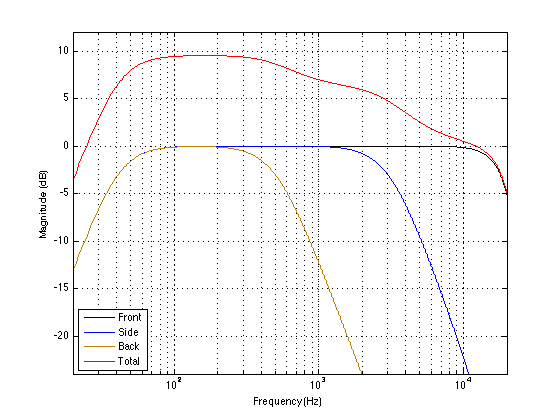
On that plot shown above, you can see the three original measurements, and the result when you add the three of them together (the red curve). In our simplified little world here, what this shows is that, if you consider the sound coming out of the loudspeaker in all directions at the same time (the red curve) you can see that there is more energy in the low frequencies than the high frequencies. So, if we normalised the two measurements (in other words, make them comparably loud (in other words, align them vertically on the graph)) and compare them directly, we see the plot show below, which shows that the power response is generally more bass-y than the frequency response.
So what? Well, if you turn on the music in the living room, and you head into the kitchen to make dinner, you aren’t on-axis to the loudspeakers. So the sound that you’re hearing has very-little-to-nothing to do with the black curve. What’s actually happening is that the sound radiates out of the loudspeaker in all directions at the same time, bounces around the living room and leaks into the kitchen. So, what you’re listening to has much more to do with the red curve than the black curve. If we were being more geeky, we would say that you’re listening to the loudspeaker’s “power response” (because we’re talking about the sum of the total acoustic power put into the living room) instead of its “frequency response”.
That doesn’t necessarily mean that you should try to build a loudspeaker with a flat power response – that’ll sound really bright. However, it might mean that the frequency response curve you see in the magazine review isn’t the only thing that you should worry about… It also means that if you’re building a speaker for people who have more than one chair in the house (or people who have friends), you might want to worry about something more than just the frequency response.
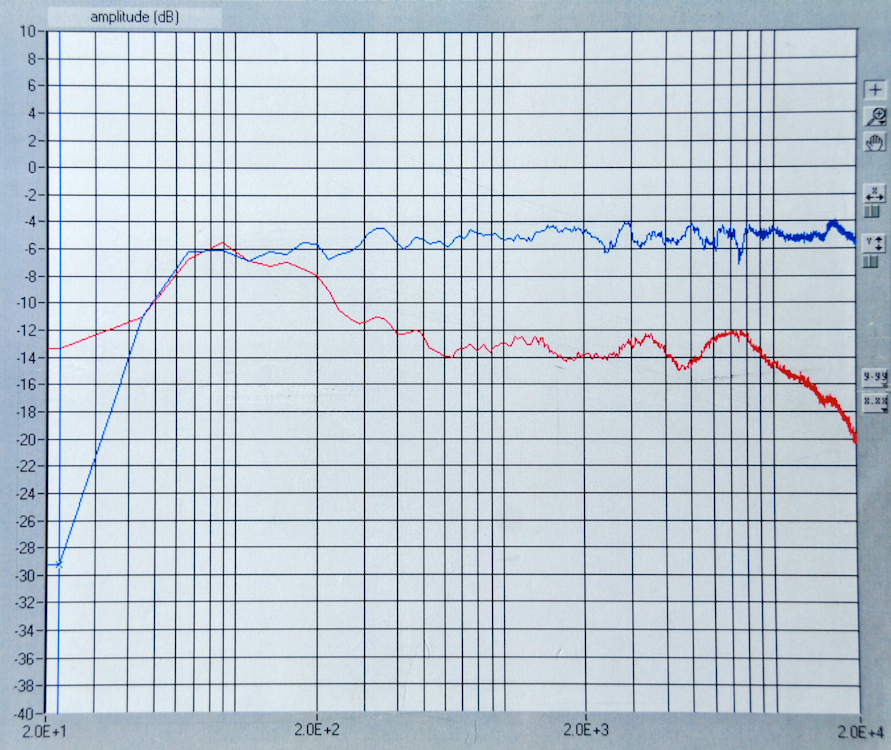
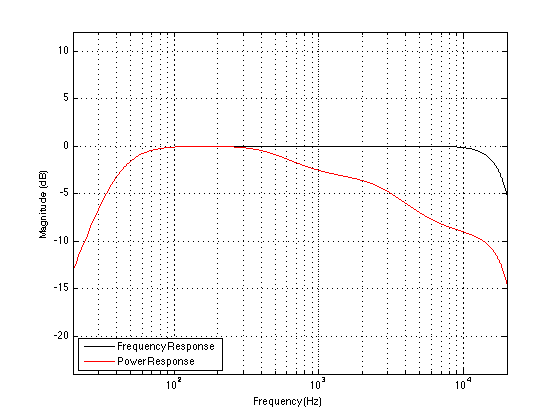
And, just in case you think that I’m oversimplifying too much here, let me prove to you that I’m not. The plots above were built on fake curves, showing what happens when I add only three measurements of a loudspeaker, one in the front, one in the side and one in the back of the device. However, take a look at the curves below. These are two real measurements of a real loudspeaker. The blue curve is the on-axis frequency response measurement (note that this is an active loudspeaker that has been equalised to have a flat-ish on-axis frequency response). The red curve is the measured power response of the same loudspeaker which was found by making a LOT of frequency response measurements around the loudspeaker and summing the results all together to get an idea of what the device was doing in all three dimensions. Looks pretty similar to the fake plot above, doesn’t it?