In the last posting, I talked about the effects of a bandpass filter on the probability density function (PDF) of an audio signal. This left the open issue of other filter types. So, below is the continuation of the discussion…
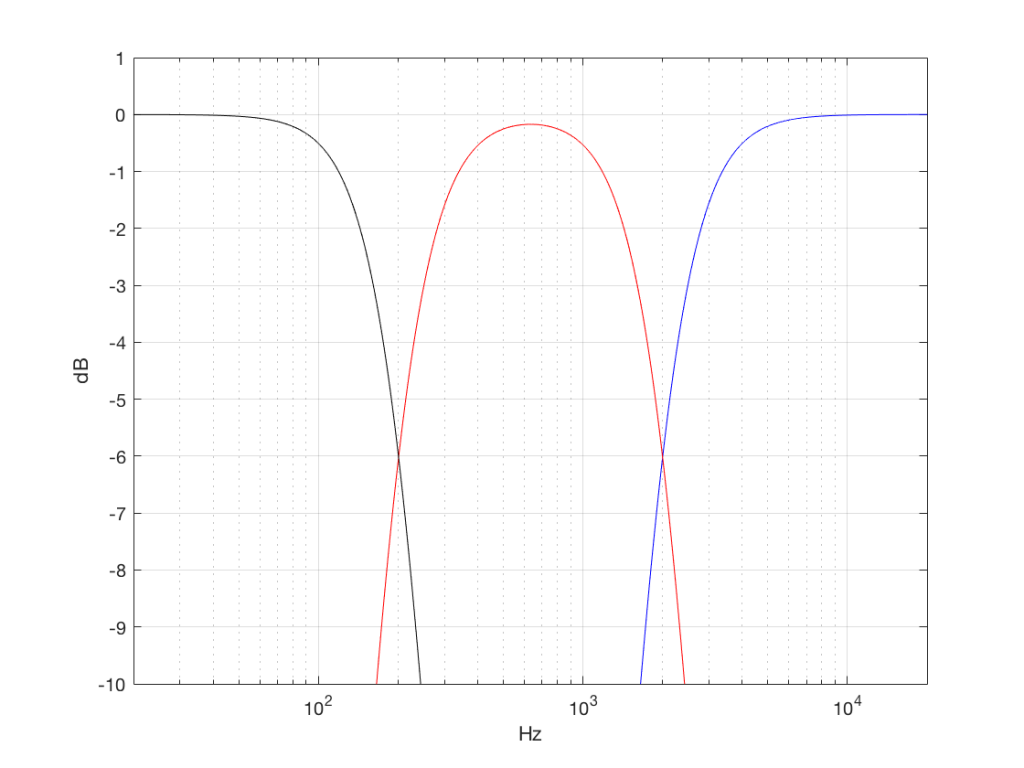
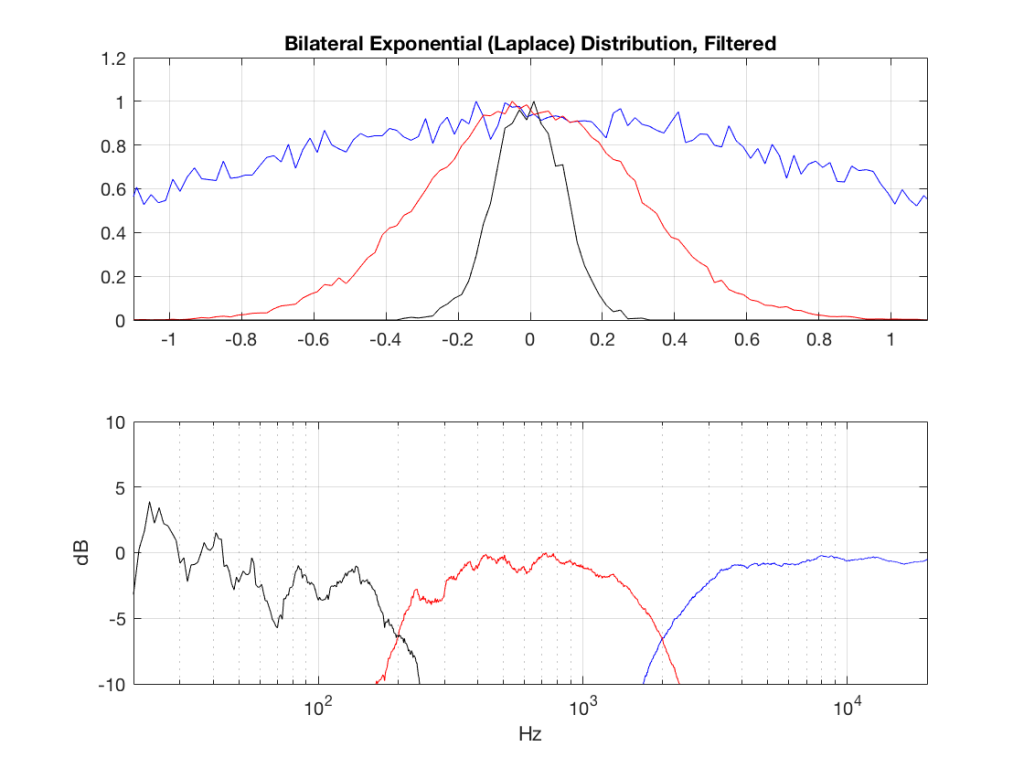
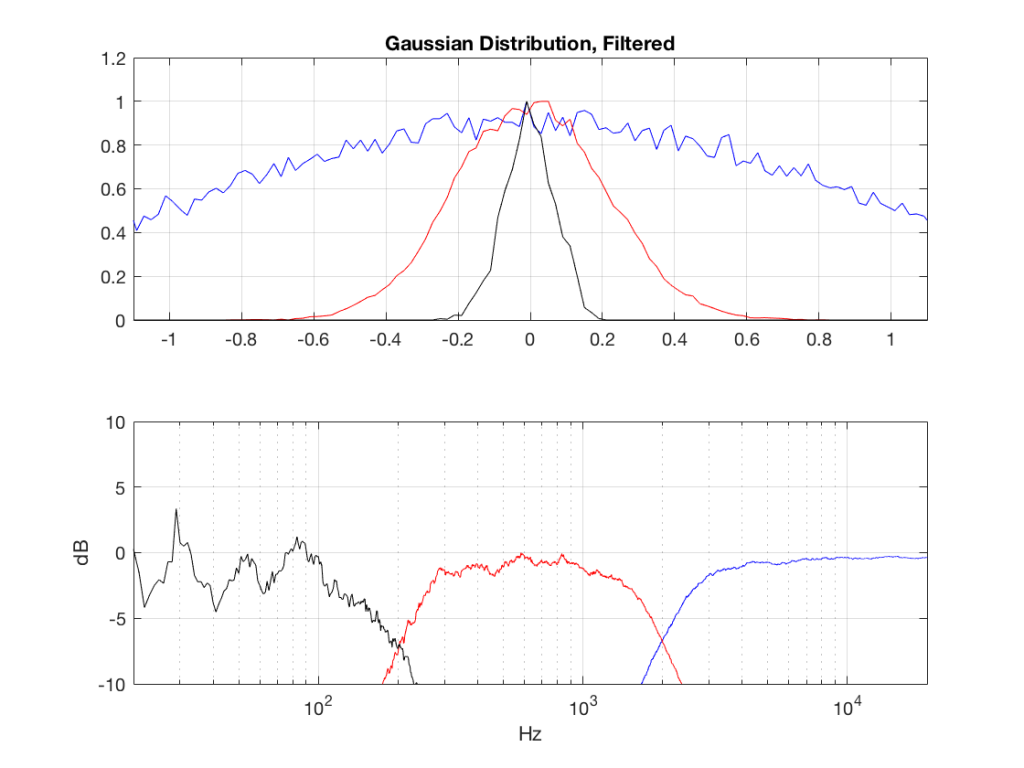
I made noise signals (length 2^16 samples, fs=2^16) with different PDFs, and filtered them as if I were building a three-way loudspeaker with a 4th order Linkwitz-Riley crossover (without including the compensation for the natural responses of the drivers). The crossover frequencies were 200 Hz and 2 kHz (which are just representative, arbitrary values).
So, the filter magnitude responses looked like Figure 1.
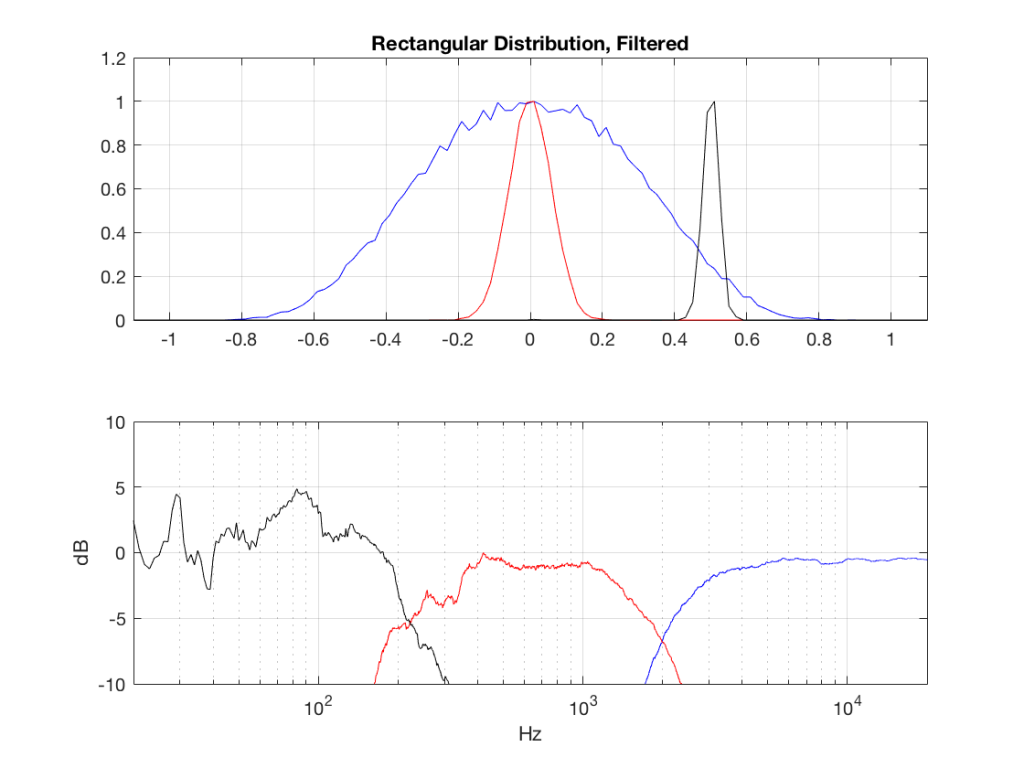
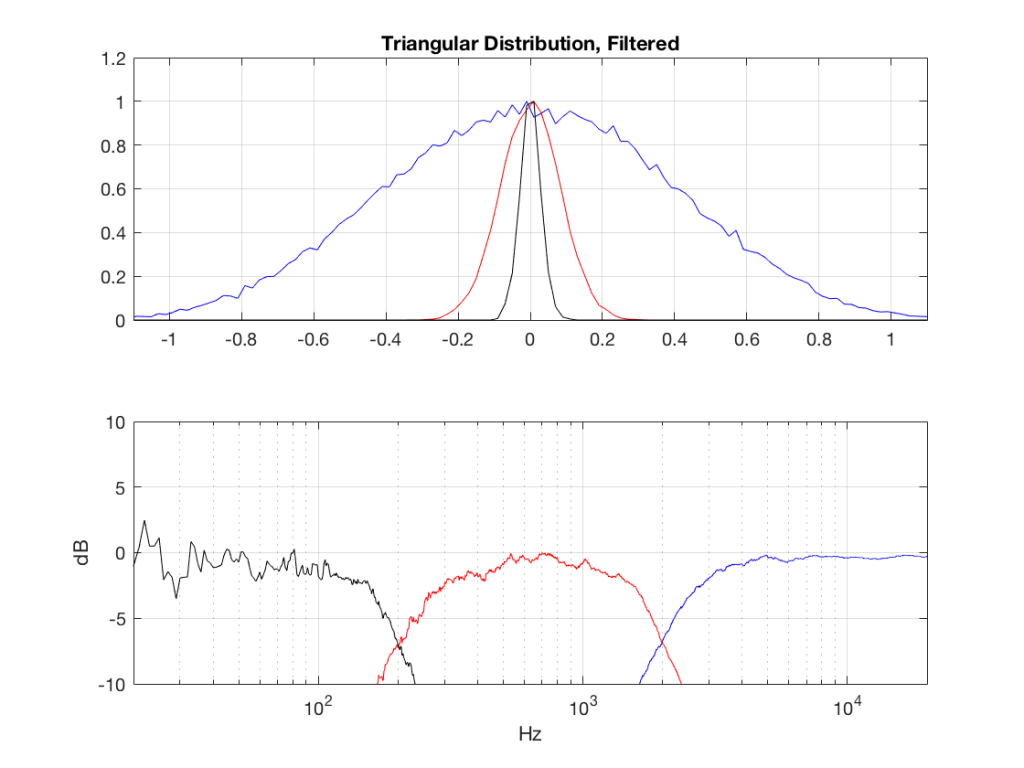
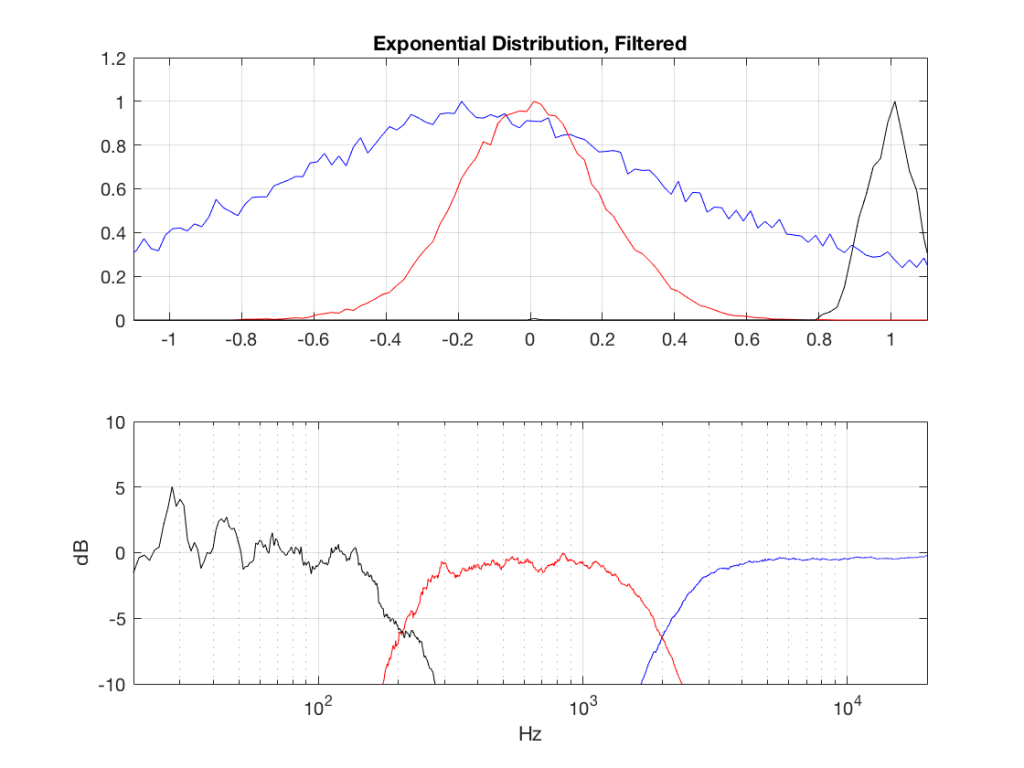
The resulting effects on the probability distribution functions are shown below. (Check the last posting for plots of the PDFs of the full-band signals – however note that I made new noise signals, so the magnitude responses won’t match directly.)
The magnitude responses shown in the plots below have been 1/3-octave smoothed – otherwise they look really noisy.

Post-script
This posting has a Part 1 that you’ll find here and a Part 2 that you’ll find here.