I know that language evolves. I know that a dictionary is a record of how we use words; not an arbiter of how words should be used. However, I also believe very firmly that if you don’t use words correctly, then you won’t be saying what you mean, and therefore you can be misconstrued.
One of the more common phrases that you’ll hear audio people use is “out of phase” when they mean “180º out of phase” or possibly even “opposite polarity”. I recently heard someone I work with say “out of phase” and I corrected them and said “you mean ‘opposite polarity'” and so a discussion began around the question of whether “180º out of phase” and “opposite polarity” can possibly result in two different things, or whether they’re interchangeable.
Let’s start by talking about what “phase” is. When you look at a sine wave, you’re essentially looking at a two-dimensional view of a three-dimensional shape. I’ve talked about this a lot in two other postings: this one and this one. However, the short form goes something like “Look at a coil spring from the side and it will look like a sine wave.” A coil is a two-dimensional circle that has been stretched in the third dimension so that when you rotate 360º, you wind up back where you started in the first two dimensions, but not the third. When you look at that coil from the side, the circular rotation (say, in degrees) looks like a change in height.
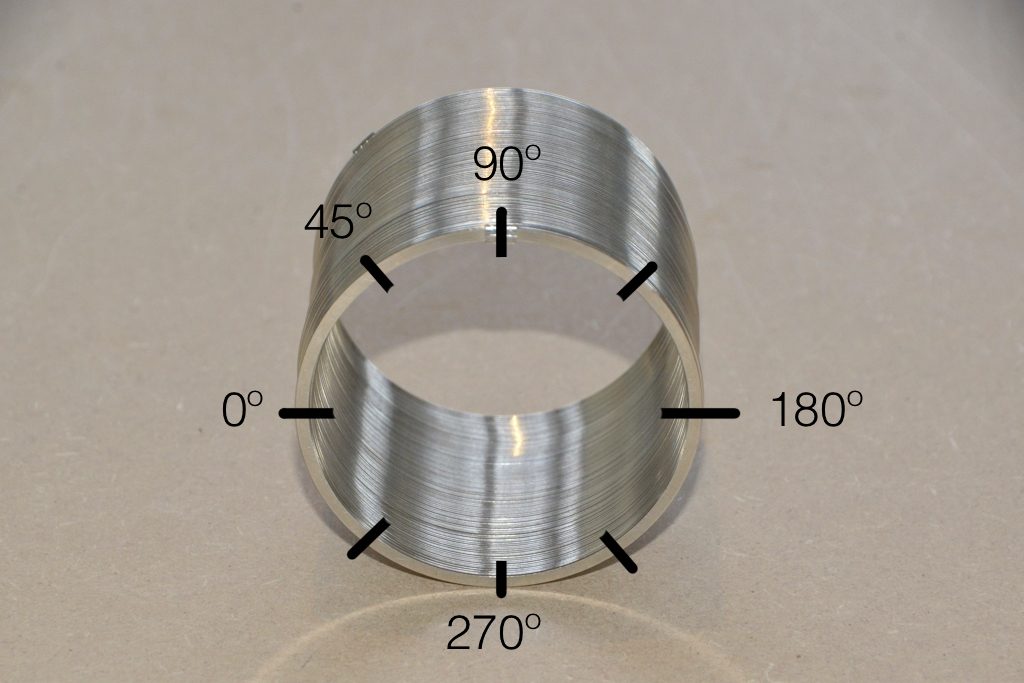
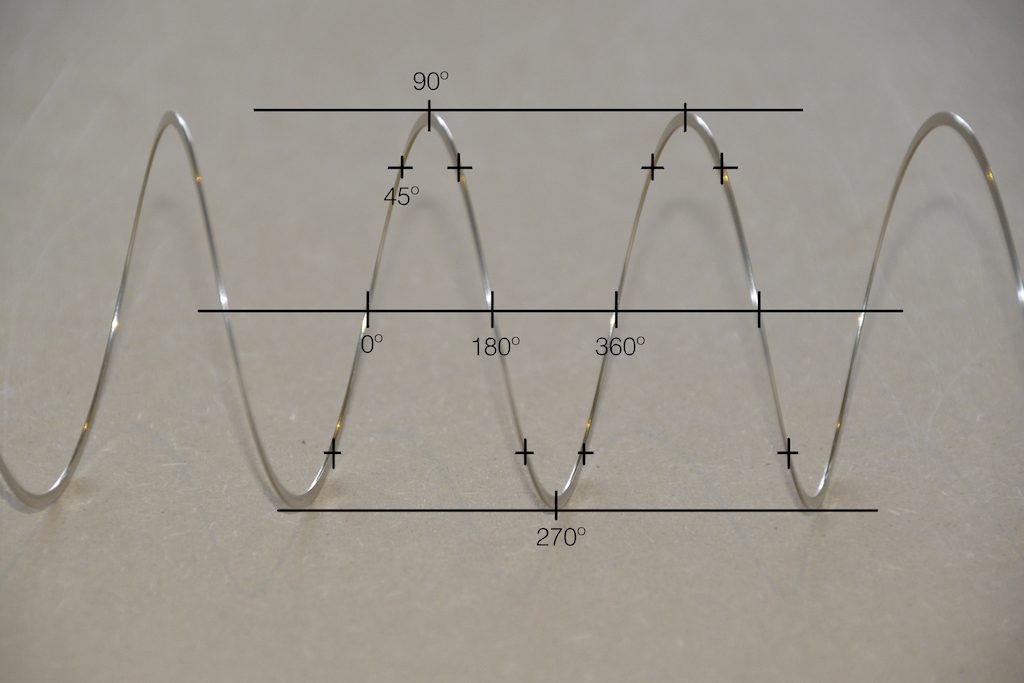
Notice in the two photos above how the rotation of the circle, when viewed from the side, looks only like a change in height related to the rotation in degrees.
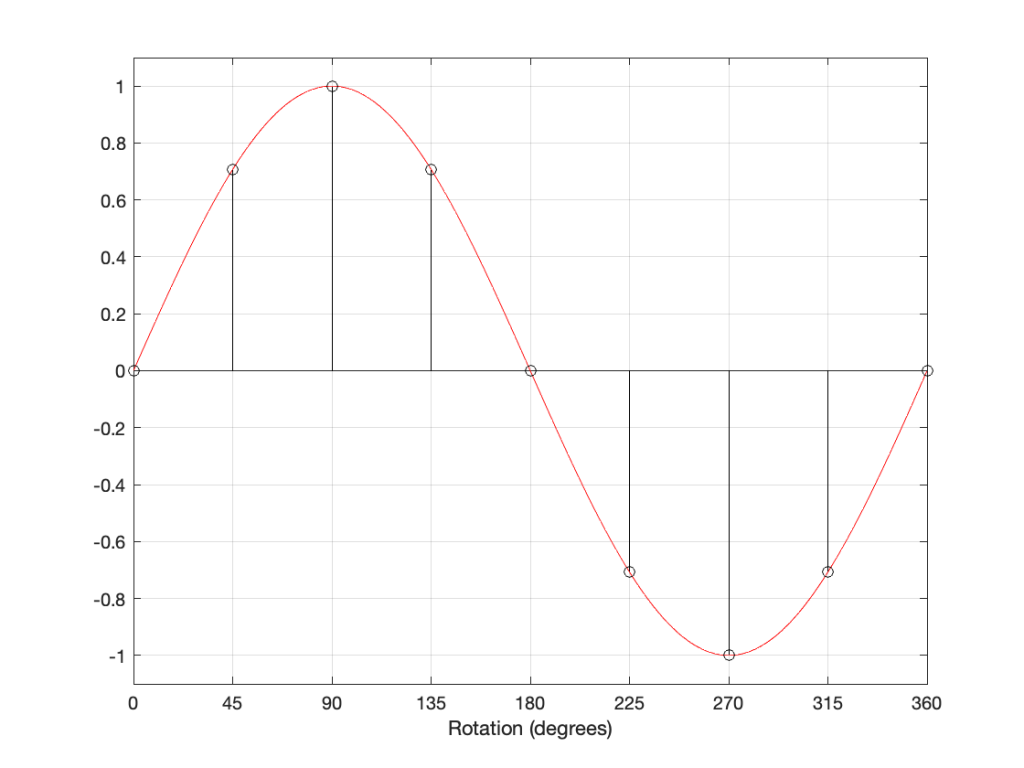
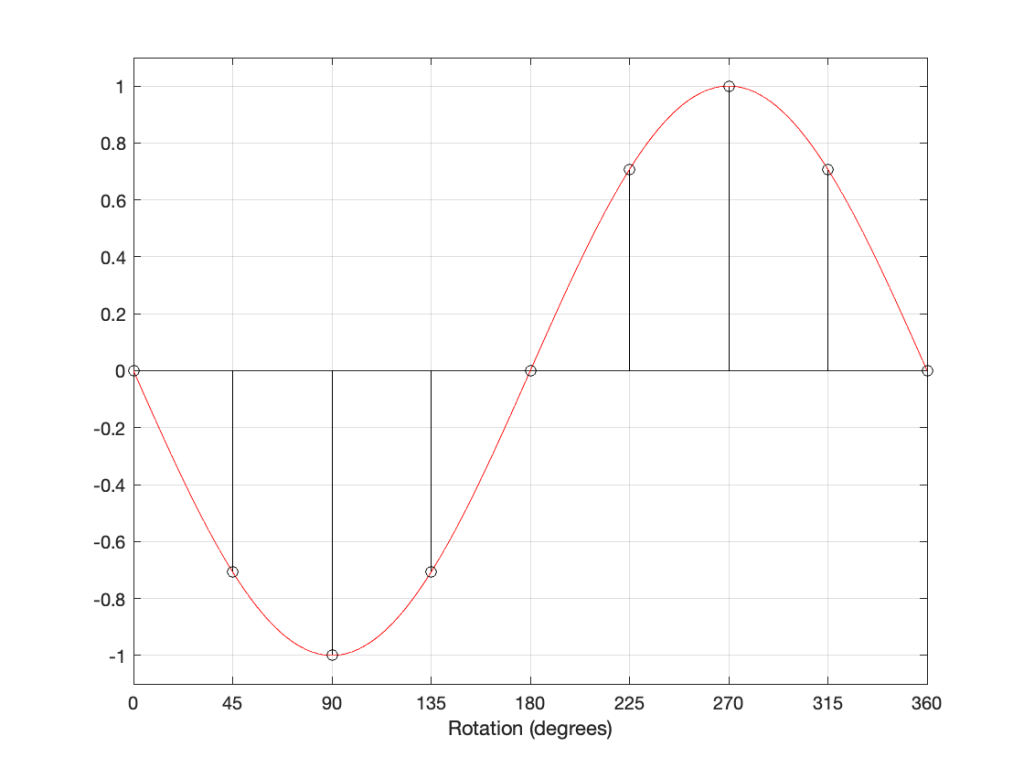
The figure above is a classic representation of a sine wave with a peak amplitude of 1, and as you can see there, it’s essentially the same as the photo of the Slinky. In fact, you get used to seeing sine waves as springs-viewed-from-the-side if you force yourself to think of it that way.
Now let’s look at the same sine wave, but we’ll start at a different place in the rotation.
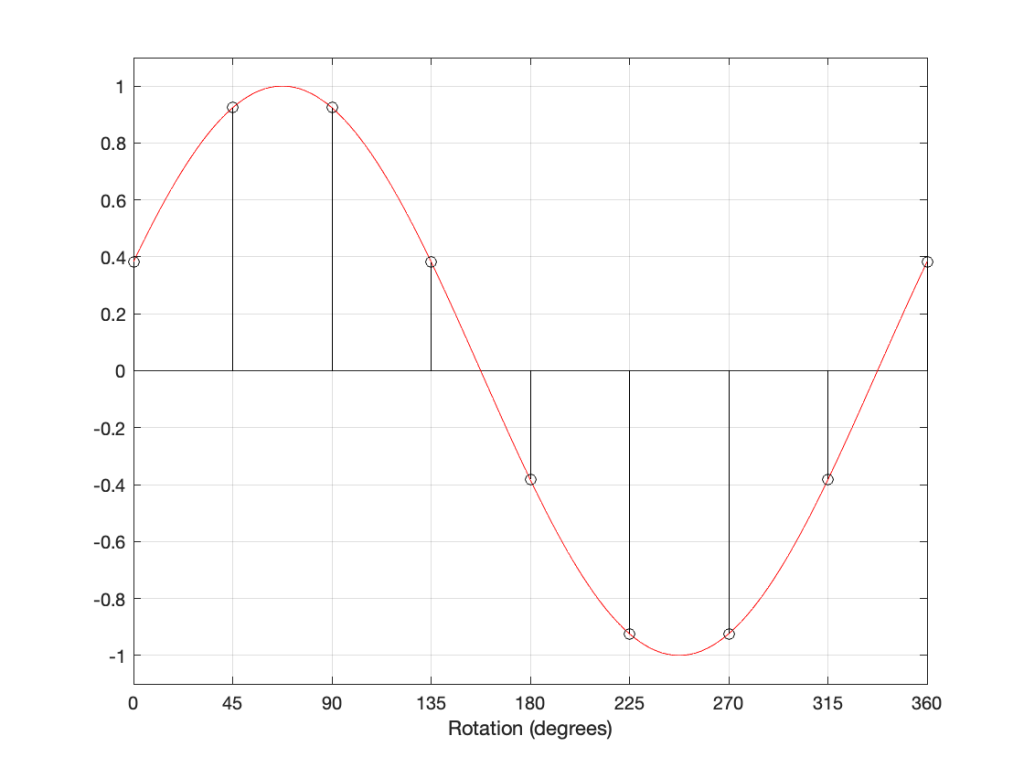
The figure above shows a sine wave whose rotation has been delayed by some number of degrees (22.5º, to be precisely accurate).
If I delay the start of the sine wave by 180 degrees instead, it looks like Figure 5..
However, if I take the sine wave and multiply each value by -1 (inverting the polarity) then it looks like this:

As you can probably see, the plots in Figure 5 and 6 are identical. Therefore, in the case of a sine wave, shifting the phase of the signal by 180 degrees has the same result at inverting the polarity.
What happens when you have a signal that is the sum of multiple sine waves? Let’s look at a simple example below.
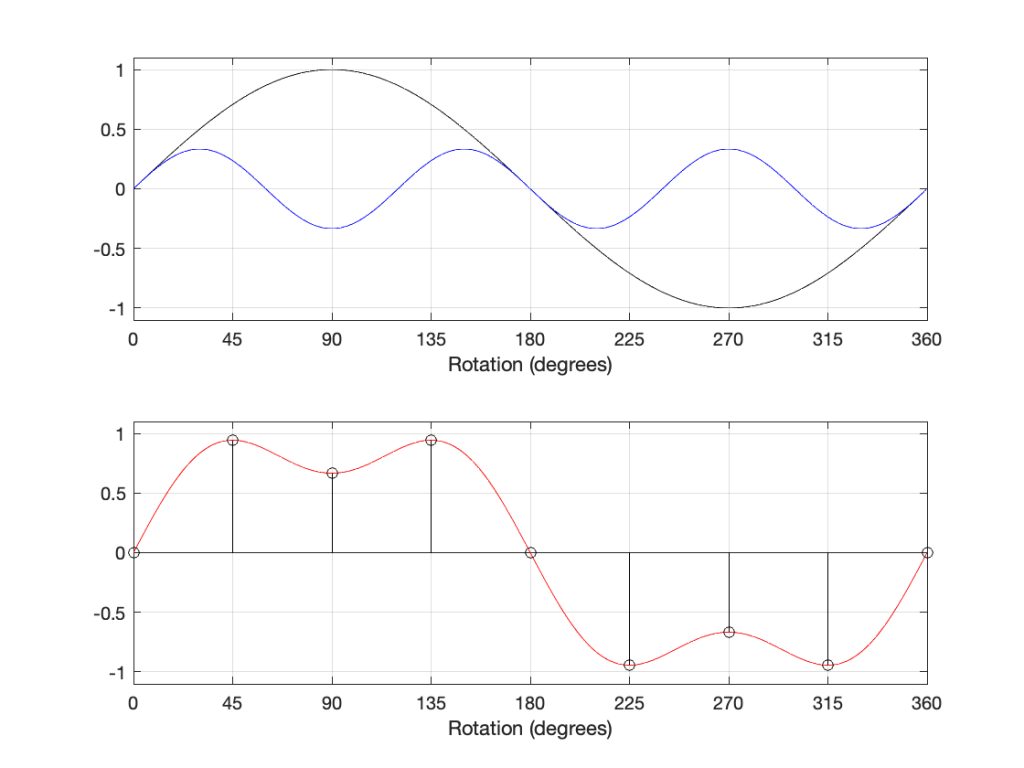
The top plot above shows two sine waves, one with a frequency of three times the other, and with 1/3 the amplitude. If I add these two together, the result is the red curve in the lower plot. There are two ways to think of this addition: You can add each amplitude, degree by degree to get the red curve. You can also think of the slopes adding. At the 180º mark, the two downward-going slopes of the two sine waves cause the steeper slope in the red curve.
If we shift the phase of each of the two sine wave components, then the result looks like the plots below.
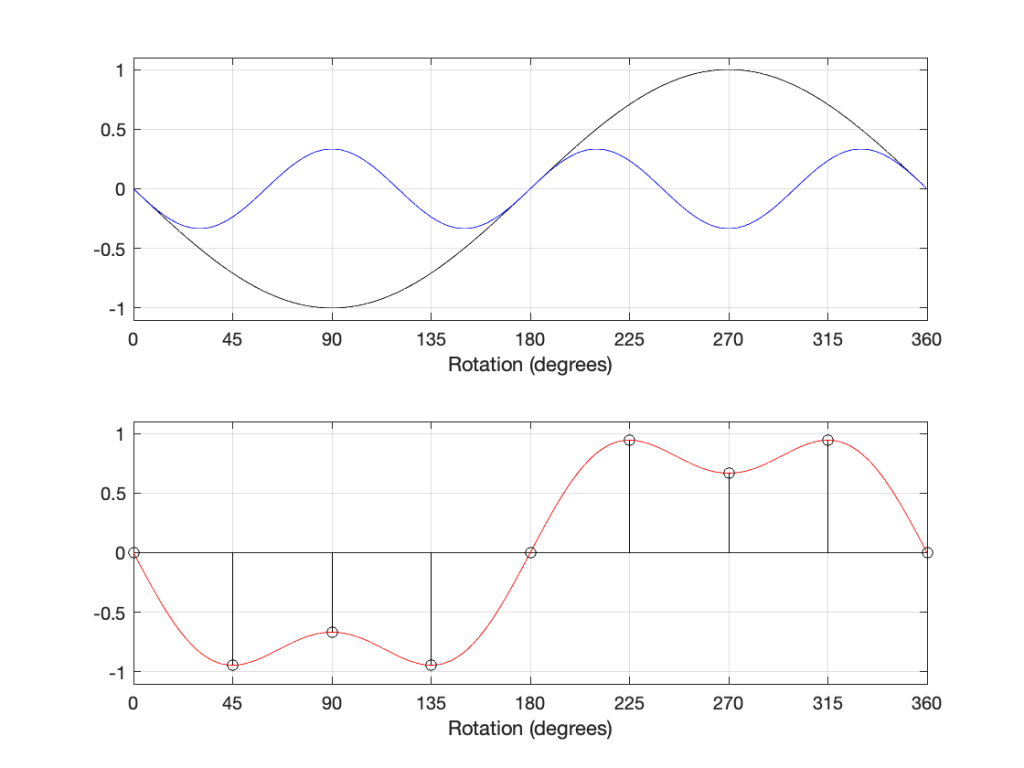
As you can see in the plots above, shifting the phases of the sine waves is the same as inverting their polarities, and so the resulting total sum (the red curve) is the same as if we had inverted the polarity of the previous total sum.
So, so far, we can conclude that shifting the phase by 180º gives the same result as inverting the polarity.
In the April, 1946 edition of Wireless World magazine, C.E. Cooper wrote an article called “Phase Relationships: ‘180 Degrees Out of Phase’ or ‘Reversed Polarity’?” (I’m not the first one to have this debate…) In this article, it’s states that there is a difference between “phase” and “polarity” with the example shown below.
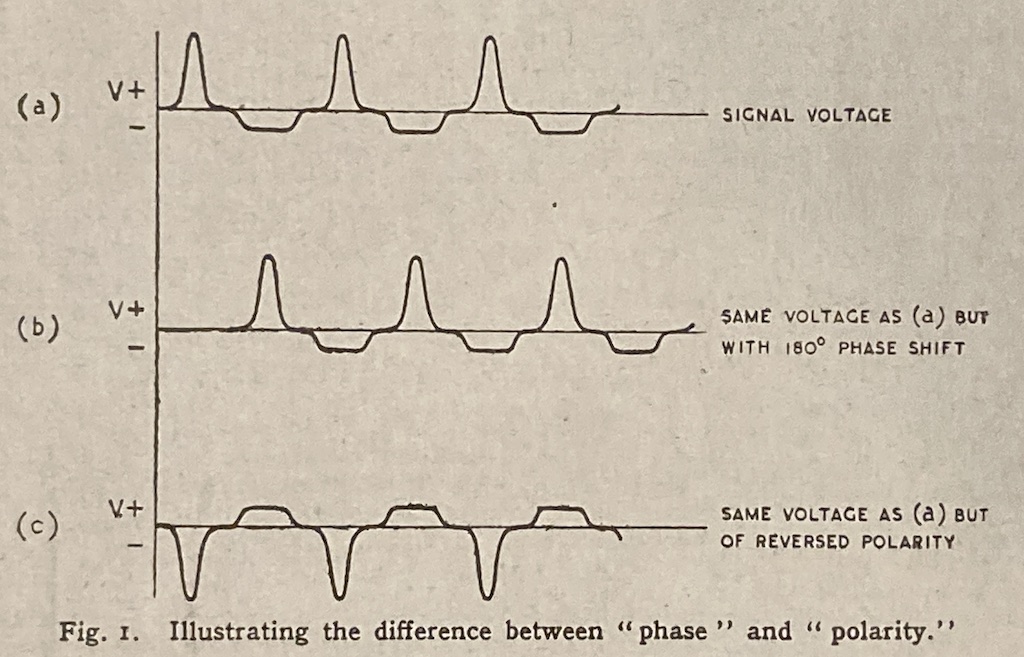
There is a problem with the illustration in Figure 9, which is the fact that you cannot say that the middle plot has been shifted in phase by 180 degrees because that waveform doesn’t have a “phase”. If you decomposed it to its constituent sines/cosines and shifted each of those by 180º, then the result would look like (c) instead of (b). Instead, this signal has had a delay of 1/2 of a period applied to it – which is a different thing, since it’s delaying in time instead of shifting in phase.
However, there is a hint here of a correct answer… If we think of the black and blue sine waves in the 2-part plots above as sine waves with frequencies 1 Hz and 3 Hz, we can add another “sine wave” with a frequency of 0 Hz, or DC, as shown in Figure 10, below.
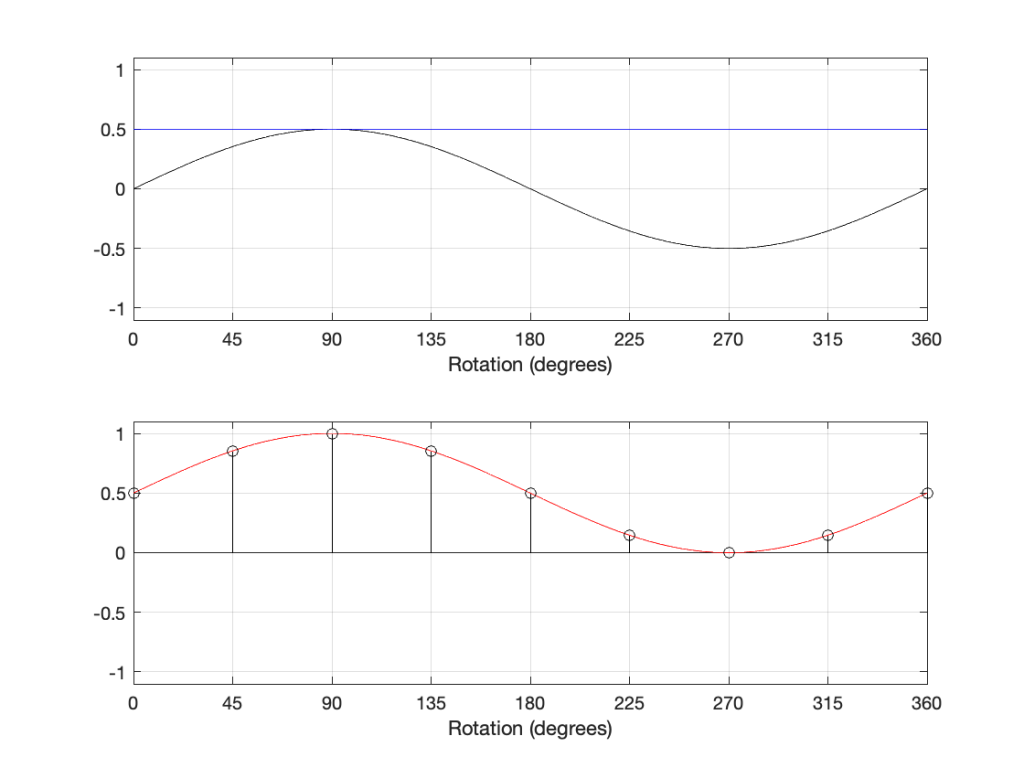
In the plot above, the top plot has a DC component (the blue line) that is added to the sine component (the black curve) resulting in a sine wave with a DC offset (the red curve).
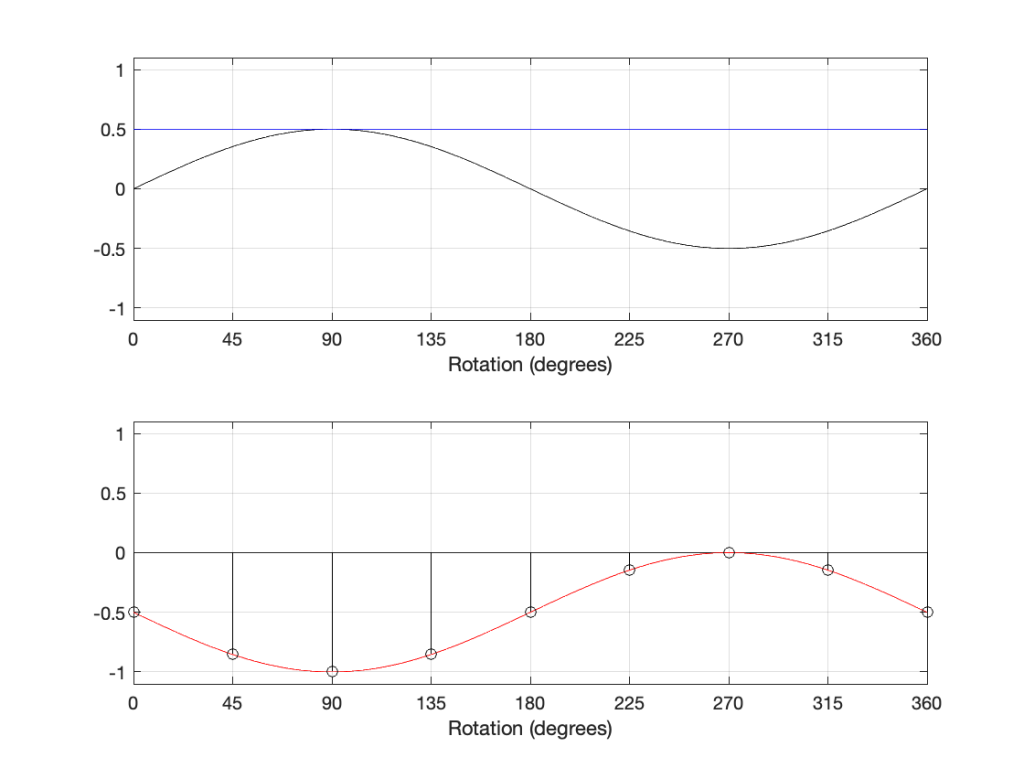
If we invert the polarity of this signal, then the result is as shown in Figure 11.
However, if we delay the components by 180º, the result is different, as shown in Figure 12:
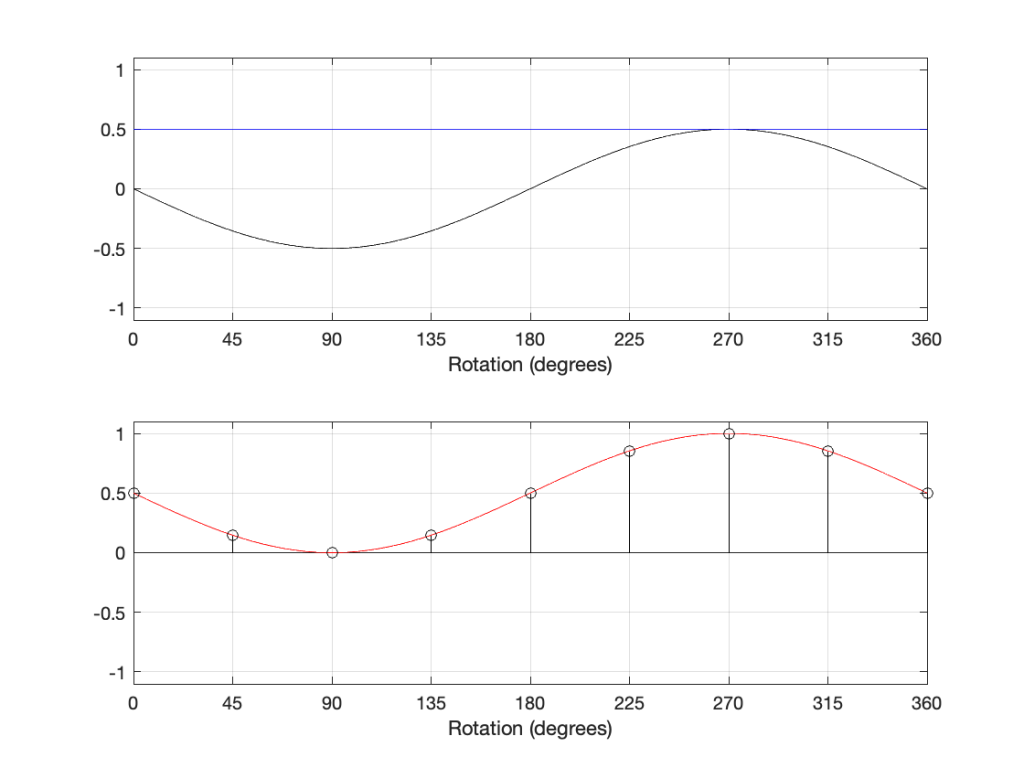
The hint from the 1946 article was the addition of a DC offset to the signal. If we think of that as a sine wave with a frequency of 0 Hz, then it can be “phase-shifted” by 180º which results in the same value instead of inverting polarity.
However, to be fair, most of the time, shifting the phase by 180º gives the same result as inverting the polarity. However, I still don’t like it when people say “flip the phase”…
