Track: No Sanctuary Here
Artist: Chris Jones
Album: Roadhouses & Automobiles
Label: Stockfisch Records
You can hear a sample of the track from the Stockfisch website here.
Track: No Sanctuary Here
Artist: Chris Jones
Album: Roadhouses & Automobiles
Label: Stockfisch Records
You can hear a sample of the track from the Stockfisch website here.
B&O received a question on one of its social media sites this week, and I was asked to write up an answer. The question was:
Hi Bang & Olufsen
I just wanna be sure of a myth that’s been going around my audio community recently. The myth is that condenser microphones are more prone to produce feedback than dynamic microphones as a result of higher sensitivity in (and reproduction of) the treble.
Is this true of false? Thanks.
This is false.
Feedback happens when you have a system where the input to a microphone is amplified and sent to the output of a loudspeaker, AND the output of the loudspeaker is received at the microphone at a level loud enough to cause the signal to get louder (instead of quieter) each time it circulates through the system. The result is a “howling” or “squealing” sound from the loudspeaker. This effect will happen first at whatever frequency has the highest gain (amplification) in the system.
That frequency could be due to a peak in the magnitude response of the microphone or the loudspeaker, or some acoustical effect of the room (such as a room mode), or something else. (For example, if you put your hand over the microphone diaphragm, making a resonant cavity, you could result in a peak in the total system’s magnitude response that would not be there if you moved your hand away.)
So, the basic problem is one of signal gain. The higher the gain (or “amplification”) of the signal, the more likely you are to have feedback. The question is: what determines this total loop gain in a typical sound reinforcement system?
There may be some other things – but that’s certainly enough to worry about.
IF you have two microphones, one is a dynamic microphone and the other is a condenser microphone, and they both have the same polar patterns, the same magnitude responses, the same sensitivities, they’re both in the same location in the room with the same orientation to the loudspeakers, and all other components in the system are identical, THEN the risk of getting feedback with the two mic’s is identical.
IF you have two microphones with different polar patterns, different magnitude responses, different different sensitivities, etc. etc. THEN the risk of getting feedback with the two mic’s is different. Whether the basic electromechanical construction is based on a condenser or a dynamic design is not the cause of the difference.
That said, it is true that microphones (both condenser and dynamic) are built with particular uses in mind. For example, (dynamic) Shure SM58 is designed to be tolerant of noises caused by it being hand-held (the diaphragm assembly is vibration-isolated from the housing) this is not true of a (condenser) AKG 451 which is designed to be mounted on a stand and not touched while you’re using it. However, this difference is not caused by the fact that one is dynamic and the other is a condenser – it’s a result of the mechanical designs of the microphones housing the “business end” of the devices. (Note, however, that this example has nothing to do with feedback – it’s just an example of microphones being designed for different purposes.)
It is also true that many condenser microphones have a magnitude response that extends to the high frequency bands with less roll-off than many dynamic microphones (there are exceptions to this statement – but I used the word “many” twice…). And, a higher sensitivity in any frequency band will result in a greater risk of feedback. However, this increased risk is a result of the magnitude response of the microphone – not its electromechanical construction. If you have a condenser microphone with a roll-off in the high end (say, an older, large-diaphragm mic, especially off-axis) and a dynamic microphone with an extended high-frequency range (i.e. a ribbon microphone, which typically has a flatter high-frequency response than a moving-coil microphone), then the dynamic will be at higher risk of feedback.
So, like I said at the start – the myth is false. If you get feedback in your system, it’s because
Either way, it’s the fault of the person controlling the system – not the construction of the microphone. As the old saying goes: “It’s a poor craftsman that blames his tools.” Or, as a friend of mine once told a class he was teaching: “If it’s too quiet, you turn it up. If it’s too loud, you turn it down. That’s the way I remember it.”
Hope this helps.
#40 in a series of articles about the technology behind Bang & Olufsen loudspeakers
Once-upon-a-time, I wrote a posting explaining why a loudspeaker’s biggest enemy is your listening room. The basic problem is as follows:
So, to borrow a phrase from South Park’s Mr. Mackey, “rooms are bad, m’kay?
For this posting, we’re going to focus only on the third issue there: that of “room modes” and a couple of ways to deal with them. To begin with, let’s talk about what a room mode is.
The PowerPoint-single-slide-of-bullet-points version of an explanation of room compensation is as follows:
That’s it. However, of course, the real story is a little more nuanced (or maybe just more complicated) than that. So, if you’re interested in knowing a little more, read on!
If you put a kid on a swing and push him (not too hard… we don’t want anyone to get hurt here…) and stand back, you’ll watch him swing back and forth, decreasing a little in distance from the resting position each time, until eventually, he’ll come to a stop. Now, do it again, and pay attention to his movement. He moves forwards, away from the resting position until he reaches a high point, then stops, comes backwards past the resting position to a high point, stops, and then moves forwards again. We’ll call that total return trip from going forwards at the resting position to being back again, going forwards at the resting position, one cycle. The number of times the kid does this for each period of time (let’s say, in this case, each minute) is called the frequency – how frequently he’s repeating the motion. The maximum distance he moves from the resting position (to the highest point in the cycle) is called the amplitude.
Now, if you pay really close attention to the movement of the kid on the swing, you might notice that, even though the amplitude of the cycle decreases over time, the frequency doesn’t change.
Another example of this kind of motion is shown in the video in this posting. However, that video is not for the faint-of-heart. Watch it at your own risk…
Okay, if you watched that video and you’re still awake, let’s move on.
There are a couple of important concepts to glean from this discussion so far.
Another example of a system that “wants” to resonate is a string that’s fixed on both ends – like a guitar string. It has a fundamental frequency that is determined by the string’s mass and tension. The cool thing about a string is that it also resonates at multiples of that fundamental frequency (better known as harmonics or overtones – which almost mean the same thing, but not quite – but the difference is irrelevant here). So, if you have a guitar string that’s tuned to 100 Hz (an abbreviation for “Hertz” which is the word we use to mean “cycles per second”) then it will also resonate at harmonics with frequencies of 200 Hz, 300 Hz, 400 Hz, and so on. If you inject energy into the string (by plucking it with your finger, for example), then the string’s total vibration will include resonances at all those frequencies, on up to ∞ Hz (in theory… not in practice…). You’ll have a resonance at each individual harmonic, each with its own amplitude (how much the string is vibrating or moving away from its resting position – the higher the amplitude, the louder it is) and the total sum of all of these results in the shape (and sound) of the string.
To see this in action, check out this video.
At this point, you’re probably wondering “what does this have to do with my room?” We’re getting there… I promise.
One last example of a system that resonates is the air in a pipe (like an organ pipe, for example). If you could shrink yourself down to the size of a molecule and get inside an organ pipe, you’d see that you’re looking down a long tube that’s capped at both ends (we won’t talk about the other kind of pipe that’s open on one end… let’s pretend those don’t exist…). If you face one end of the pipe and push the air molecule next to you towards it, it will push the one in front of it, which will push the one in front of it, and so on, until the shoving match ends at the cap at the end of the pipe. (See this page for a good animation of the story so far…) That last molecule can’t push the “wall” so it bounces back, which winds up in a return shoving match (or pressure wave…) that will eventually push against you, and you’ll push the molecule behind you, which keeps repeating until the wavefront gets to the cap at the opposite end of the pipe, which reflects, and sends wavefront back to you again.
Now, what happens if, while all of that is happening, you are pushing repeatedly? Every time the wave bounces back at you, you push it again in the same direction that the particles want to move in (this is exactly the same as pushing a kid on a swing at exactly the right time to make him swing higher and higher – you time the push so that he’s moving in the same direction as you’re pushing).
Take a look at the top part of the animation below.
Let’s say that you’re the red molecule and you’re in a pipe. You push and pull the two adjacent particles (one in front, one behind) exactly in sync with the wave that’s reflecting off the two ends of the pipe, and you’re helping to inject energy into the fundamental resonance of the air column inside the pipe. The result is something called a “standing wave”. it’s called this because it looks like the wave is “standing still” and just changing in instantaneous amplitude over time, but the reality is that this is just an illusion. What is actually happening is that the right-going wave is aligned with the left-going wave to perfectly cancel each other out at all times in the middle of the pipe, and to result in big changes in pressure at the ends of the pipe. Check out the third animation on this page for a good explanation of this summing or “superposition” of waves resulting in a standing wave.
Just like a string, a pipe will also resonate at harmonics of the fundamental, in multiples of the frequency of the lowest resonance. So, if the pipe resonates at 150 Hz, then you will also have resonances at 300 Hz, 450 Hz, and so on… I’ll show some animations with examples of these later in the posting.
The nice thing (at least it’s nice in that it helps our understanding – it’s not actually nice in real life…) is that a room behaves just like a very big, very wide, organ pipe. So, for example, when I sit in a listening room that is 5 m wide by 6 m long, some of the resonances that I hear “singing along” with every sound source in the room are exactly the same frequencies as the ones that would come out of organ pipes 5 m long and 6 m long.
Take a look at that animation above once again. You can think of the red dot as the loudspeaker, pushing and pulling the adjacent air particles in time. You sit at the listening position at the black dot – the adjacent air particles push and pull your eardrum in and out of your head. The pressure of the sound wave (the only thing we’re going to worry about in this posting) can be thought of as a measure of how close two adjacent air particles are (shown by the three vertical lines in the top part, and represented by the entire bottom part of the animation).
So, as the loudspeaker woofer (for example) moves in and out of the enclosure on a kick drum hit, it injects energy into the room at many different frequencies. If the frequency of the resonance in the room is one of the frequencies in the woofer’s signal, then that note will sound much louder than the other notes, making for a very uneven bass. This is because the room “wants” to resonate (or “sing along”) at that particular frequency, so a little energy coming into it will give a large result (just like a series of small, but well-timed, pushes of a kid on a swing can build up over time to result in the kid moving back and forth much more than you’re pushing).
This will happen not only at the fundamental frequency of the resonance, but its harmonics. The second harmonic is shown below.

The third harmonic looks like the animation below.

And the fourth harmonic looks like the animation below.

We won’t go any higher than this.
There are some things to notice in these animations.
If you are sitting at a point in the room where there is no change in pressure caused by the mode (say, for example, you’re the black dot in Mode #2, above), then you will not be able to hear the room mode. It’s still happening around you – but at your exact position, since there is no change in pressure over time, it doesn’t exist. However, this doesn’t mean that you won’t hear anything at that particular frequency – you will – it’s just that the sound you hear (from the loudspeaker) doesn’t have the room mode singing along with it at your location.
Similarly, if the loudspeaker is placed at a location where there is no change in pressure when the room mode is ringing (for example, the location of the red circle in Mode #3), then the loudspeaker will not trigger this mode to ring. Energy will come out of the loudspeaker at that frequency, and you’ll be able to hear it – but the room mode will not “sing along” with the signal, since the loudspeaker can’t inject energy into it. (Note that this is statement is based on at least two assumptions: (1) that the loudspeaker is a pressure source, and (2) that it is infinitely small. At least one of these assumptions is incorrect.)
This means that, looking at the four animations above, and assuming that the red dot is the loudspeaker and the black dot is the listener:
As I said in the PowerPoint version above, we have two basic strategies for dealing with room modes.
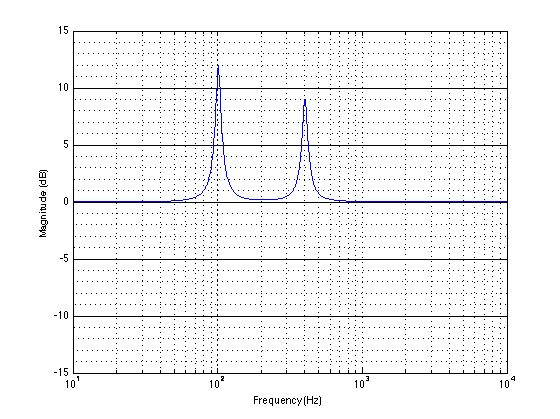
The first is a “symptom attenuation” approach: the room mode makes some frequencies louder than others, so we’ll just reduce the level of those frequencies by the same amount. If the room boosts 100 Hz by 6 dB, then we’ll put a dip of -6 dB at 100 Hz in the signal sent to the loudspeaker. This doesn’t actually correct the problem – it just covers it up. It’s a bit like taking a pain killer because you’ve broken your leg. You are no longer in pain, but the problem still exists… The trick here is to measure the response of the loudspeaker at the listening position (this is easy) and find out which frequencies appear to be boosted by the room. We then make an equalisation which is that same response turned “upside down” so a peak in the measured response becomes a dip in the loudspeaker’s processing.
As I said, this covers up the problem but it doesn’t solve it. The thing to remember is that a room mode appears to be louder because the room moves the energy in time. For example, if you pluck a guitar string, you “activate it” for a very short period of time. The resonance of the string takes that energy and extends it in time so you hear a note that goes on for seconds after the pluck. A room mode does the same thing – it “rings” in time, smearing the energy coming out of your loudspeakers (say, a kick drum hit) and extending it like a guitar string ringing. If you send less energy out of the loudspeaker at the same frequency of the room mode, then the total result at the listening position will be quieter, but it’s still ringing in time. (So, instead of plucking the guitar string and then stopping it, we’re just plucking with less force.)
The second method is a little more complicated, but works better. Since we have control of the loudspeaker, what we can do is to send the sound we want out of it – but we’ll add an extra signal that cancels the room mode by working against it. If we go back to the original description where we were a little air particle in a pipe, we send the signal out, and when it comes back, reflected off the cap, we’ll send a signal out of the loudspeaker that “sucks it back in”. This way, the loudspeaker acts as an active absorber. (This is a little like the way a person on a trampoline can stop jumping by using his/her legs to absorb the push-back from the springs. See this video at 0:53, for example.)
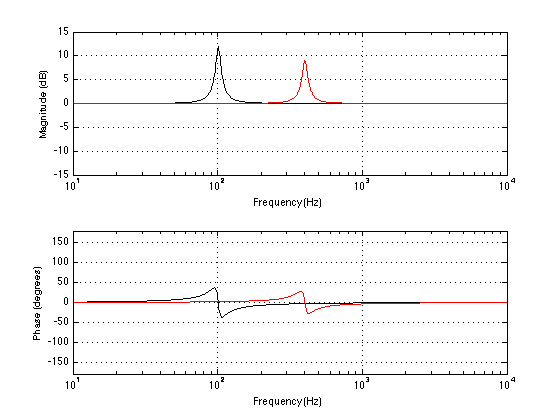
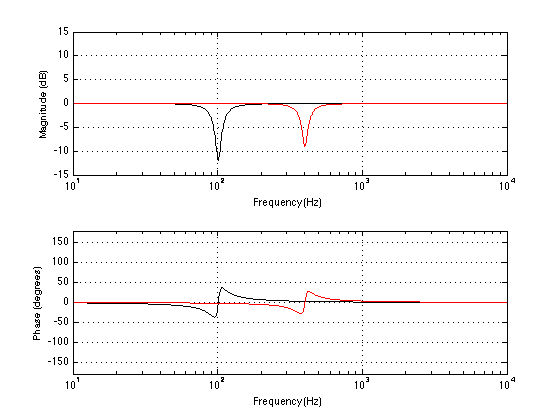
The great thing is that, if you’re smart and a little lucky, both of these approaches are the same thing. If we consider the room mode to have the same characteristics as a “minimum phase” peaking filter (which, in isolation, it does), then, if we can measure it correctly, we can implement its exact reciprocal. This means that the magnitude response of the filter we insert into the loudspeaker’s processing will be the exact opposite of the room’s response. In addition to this, the phase response of the filter is, at any frequency, opposite in polarity to the phase response of the room mode (in isolation). This means that both approaches are rolled into one solution.
Of course, this is very theoretical. However, in practice the concept holds true enough that it results in a noticeable improvement in the sound of a loudspeaker in the listening position, assuming that you are careful about the measurements you make around that position. If you choose to make a room correction filter that applies to the whole room, and not just one listening position, then you should measure the room in many different and varied locations. This will give you a “general” compensation that is better, on average, for everyone in the room – although it might make one specific location (like, say, the sweet spot) worse. If, instead, you just measure one location by placing the microphone in a tight area around the sweet spot, for example, then the compensation filter will be optimised for that location, but it will probably make the rest of the room worse as a result.
Active Room Compensation gives you this option to customise the room compensation filters as they best suit your needs. If you’re the kind of person with one chair and no friends, then you measure around that chair and you never leave it while you’re listening. If you’re the kind of person who has lots of friends, or who moves around while you listen, then you create a compensation filter that fixes the entire room, on average.
Of course, in a perfect world, you would be able to make both of these measurements in advance and save each one as a preset – then you would be able to select the one that best suits the situation when the time arises… Or, you could combine them and build a filter that corrects the room, with emphasis on the sweet spot…
P.S. As I mentioned briefly in this posting, Active Room Compensation has one additional feature – multichannel processing. That will be explained later in Part 2.

In case you have trouble falling asleep. This should do the trick…

Finally! I get to combine earfluff and eyecandy in one posting!
There are more schlieren photos at wikipedia.
#39 in a series of articles about the technology behind Bang & Olufsen loudspeakers
“If you saw a heat wave, would you wave back?”
– Steven Wright
Once upon a time, back in the “olden days” (as my kids call them), before I worked at Bang & Olufsen, I did a Master’s degree at McGill University as a tonmeister (hence the domain name…). In practice, this means that I was trained to be someone who knew as much about things like room acoustics, microphone techniques, recording practices and electronics as I did about music. (Of course, if I knew nothing about music, then this equation falls apart…) In practice, what it meant was that I spent a LOT of time in recording studios (literally more time than I remember) doing recordings or just listening to them.
Now, let’s think about the design of a typical “good” recording studio control room. Usually, you have a mixing console in the middle of the room, and at least one pair of small studio monitor loudspeakers sitting on the meter bridge. Also, up on the front wall, there’s a large pair of “soffit mounted” loudspeakers built into it. Figure 1, below, shows an example of this.

One story I heard back in the “olden days” was that, if you’re building a recording studio, you should always keep the amplifiers for your big soffit-mounted loudspeakers away from (or at least above) the loudspeakers themselves. You should never NEVER put the amps directly under the loudspeakers. The story went that the reason for this was that hot air rising from the amplifiers would waft past the tweeters, modulating (changing) the speed of sound of the air between the tweeters and the listening position. And, since this modulation was random, then this heat would sometimes cause the right channel to arrive at the listening position earlier than the left, sometimes later. The result (according to the story) would be a constant shifting of the phantom image, moving left and right instead of staying exactly in the middle where it should be. The analogy/metaphor/explanation was that the image location would “shimmer” in the same way that there appears to be water on hot asphalt in the distance on a summer day, or the way you can see heat rising from a hot surface like a barbecue.
Fast-forward about 25 years, and I’m sitting in a meeting at B&O, discussing mechanical design options for high-end loudspeakers. Someone in the room says “one possibility is to put the radiators for the amplifiers on the face of the loudspeaker, just under the midranges and tweeters” and I say “you can’t do that – you’ll screw up the phantom imaging”. Heads turn to look at me, the expressions on the faces obviously say “what on earth are you talking about?” So, I tell the story that I heard back in the olden days…
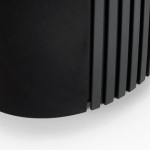
Quick sidebar: if you don’t already know, almost all Bang & Olufsen loudspeakers are active loudspeakers, which means that the amplifiers and power supply are inside the loudspeaker enclosure. Amplifiers and power supplies are never 100% efficient. In addition to this, because we use DSP to control the loudspeaker, we can push our loudspeaker drivers to their limits without melting their voice coils – this also results in a lot of heat. All of this means that our loudspeakers need a lot of thought into their thermal design – basically, we need to make sure that the heat can get out, which is why we need radiators like the one shown in the photo on the right (which shows the bottom of the back of a BeoLab 20. The vertical stripes are a metal radiator attached to the electronics inside.). We now return you to your regularly scheduled story…
Some of the engineers in the room say “that’s crazy” – and others (the ones I like) say “let’s find out…” So, using the modern tools for finding-things-out, we started by typing things like “loudspeaker amplifier heat phantom image” into Google. This resulted in no information – or at least no useful information. So this meant that we had to do an experiment.
Okay, so the question is: does heat rising in front of a tweeter have an effect on the sound that it radiates? And, if so, what is/are the effect(s) and what kind of magnitude of effect are we talking about? The easiest way to find this out is to exaggerate the effect. So, we got a tweeter and a hot plate (which lives in the acoustic department exclusively for warming risalamande at the yearly Julefrokost (the ubiquitous Danish “Christmas lunch” literally translated, although it can happen as early as November, it rarely starts at lunchtime, and typically extends well into the evening…) and we set them up as shown in Figure 2.

We put a microphone in front of the tweeter at a distance far enough away that the microphone wasn’t getting heated by the hot plate (about a metre or so…), and we sent a high frequency tone (20 kHz) to the tweeter from a sine wave generator. Then we simply sent the original signal and the output of the microphone to an oscilloscope so that we could look at them in real time.

Figure 3 shows the result when the hot plate was turned off. The original signal and the microphone signal are both clean, as you can see there.
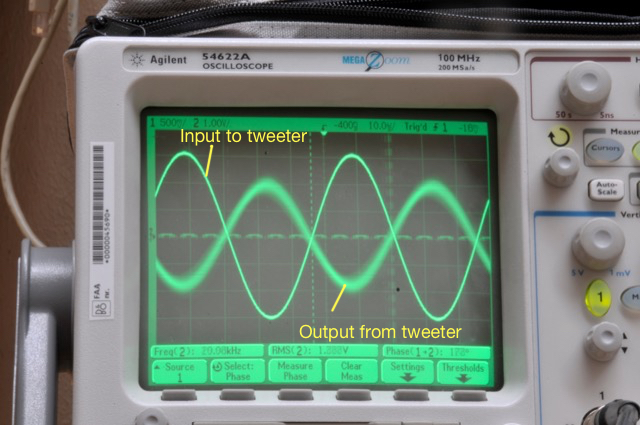
Figure 4 shows the same thing, but the hot plate is now set to “medium”. As you can see there, the output from the tweeter is much more “blurry”. This is because it is moving on the screen over the 30 seconds of the photo exposure. Note that it is moving in both the X-axis (meaning the level was changing over time) and the Y-axis (meaning that the time of travel from the loudspeaker to the microphone was changing over time).
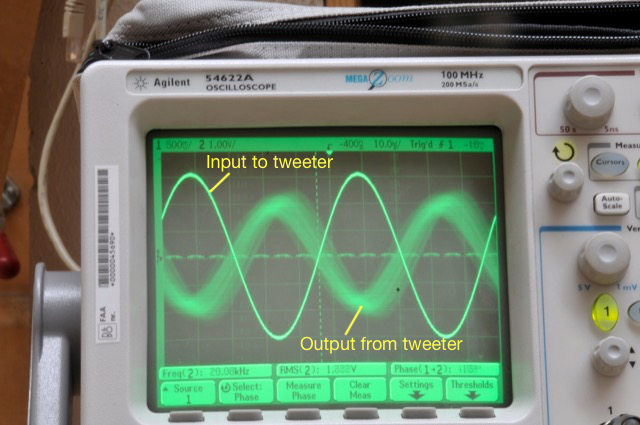
Figure 5 shows the same thing, but the hot plate is now set to “maximum” (hot enough to boil water or to burn risalamande). As you can see there, the output from the tweeter is even more “blurry”for the same reason. It’s also fairly easy to see in that photo that the output from the tweeter is modulating in both axes.
One thing to be clear of here is that we are looking at the effect of modulating the temperature of the air in front of the tweeter. We’re not changing the temperature of the tweeter itself (at least, not with the hot plate – the tweeter heats itself, but that’s another story) or the microphone.
Okay, so we had some proof that the story that I heard back in the recording studio might be true. At the very least, we found out that it would be easy to measure the effect of heat rising in front of a tweeter. Now we had to get a little more useful data by analysing the signal from the microphone a little better. Looking at the signal on an oscilloscope is good for intuition, but it’s hard to graph the results.
So, this time we changed the setup a little. We used a little studio monitor loudspeaker (with some minor alterations – we taped over the ports to ensure that we weren’t modulating the air around the loudspeaker as a result of airflow through the port, just in case… for the lower frequencies… Since we were only playing sine tones and we’re not really interested in the absolute magnitude response of the loudspeaker, the lack of a port didn’t matter too much to us…) and we recorded the microphone output instead of just looking at the signal on a ‘scope. (We were also careful not to move during the recordings, partly to reduce background noise, but also to avoid creating air currents … just in case…) The total setup (although it’s still pretty simple) is shown in Figure 6.

We also tried measuring the air temperature in front of the loudspeaker, but this was difficult because it was fluctuating so much and so rapidly. So, instead, we put a power meter on the mains feed to the hot plate to get a better idea of how much constant power we were using.

Our analysis was to see how much the phase and the magnitude were changing over time with different frequencies and different settings of the hot plate temperature. This was done by analysing the recordings of the microphone signal for a 30-second period. The results turned out to be different for different frequencies – and surprisingly large in some cases…
Some details for the geeks-amongst-you:


As you can see above in Figures 8a and 8b, there was almost no effect on a 250 Hz tone, even when we pushed the hot plate up to 700 Watts. There is a very small change in magnitude, however this might be caused by background noise.


As you can see above in Figures 9a and 9b, at 1 kHz the effect is not getting much more noticeable.


Figures 10a and 10b, show the modulation for 4 kHz. Now we’re starting to see some effects…


Figures 11a and 11b, show the modulation for 16 kHz . You can see there that, in a worst-case scenario, we’re getting magnitude changes on the order of +/- 3 dB or so (which would mean, in a stereo system, a worst-case difference between the two loudspeakers’ signals of about 6 dB), and phase changes on the order of about +/- 40 degrees (so a worst-case difference between the two loudspeakers’ signals of about 80 degrees).
If we then look at the peak-to-peak variation in the above graphs and plot that as a function of hot plate power consumption for the different frequencies, we get the results shown in Figures 12 and 13.


So, the conclusion from the measurements was that the effect was considerable at high frequencies and high temperatures, but might be significant at lower values as well… the question was to ask “what is significant?”
Luckily, for the phase modulation part of the question, we had a partial answer from an experiment that we did a long time ago. In a paper called “Audibility of Phase Response Differences in a Stereo Playback System. Part 2: Narrow-Band Stimuli in Headphones and Loudspeakers” (Presented at the 125th ) , Sylvain Choisel and I reported that subjects were able to detect phase response differences in loudspeakers with a threshold of approximately 50 degrees phase difference, regardless of frequency – although we only tested up to 8 kHz… Apart from the 16 kHz measurements in this experiment, none of the frequencies we measured came close to a worst-case difference of 50 degrees – so we’re probably safe on that one. (Although geeks might be interested to see the below for a little more discussion about this issue looking at it from a perspective of time instead of phase.)
The magnitude response differences may be a similar story. Many studies have been done to find out what differences in level between loudspeakers result in changes in phantom image placement – for example, see this site for a good summary. As can be seen in that graph, a 1.5 dB difference (chosen because that’s the worse-case value for the 1 kHz curve in the plot in Figure 12) in level between the two loudspeakers (measured at the listening position) will result in something like a 15% to 20% shift in phantom image location away from centre (that’s 15% to 20% of the distance to one of the loudspeakers from centre) which will probably be noticeable if you’re paying attention, although it might sound more like a “fuzzy” centre image instead of a moving one… A 6 dB difference (roughly the worst-case value for the 16 kHz curve) can result in an approximately 60% shift in phantom image location. Note, however that we might be jumping to (incorrect) conclusions here, since some of the data in the plots on that PDF file I linked to above are from listening tests with full-range signals. Whether the values will be valid for narrow-band signals, especially at 16 kHz is unknown…
Take a look at the side view of our setup, shown below in Figure 14.

This is a simplified version of what is happening in the experiment. The sound wave travels outwards from the tweeter, through the air. However, that air has one area where the temperature is significantly different than the rest of the room.
The speed of sound in air can be calculated as follows:
c = 331.3 + (0.6 * T) m/s
where T is the air temperature in degrees Celsius.
So, for example, if the temperature of the air increases by 10ºC, then the speed of sound increases by 6 m/s. If the temperature increases by 50ºC, then the speed of sound increases by 30 m/s. This will change the time of arrival of the sound at the microphone – the hotter the air, the earlier the sound arrives.
However, this change is a change in time. This converts to a change in phase in the sine wave that we were measuring – but you have to remember that a given change in time is equivalent to a change in phase that increases with frequency. For example, a 1 ms delay change is equivalent to a 45º phase shift at 125 Hz, but a 90º phase shift at 250 Hz, a 180º phase shift at 500 Hz, and a 360º phase shift at 1 kHz, and so on…
So, another way to look at this problem is to consider the change in interchannel delay instead of interchannel phase. If you take a look at this site again, you can see that our perception of the phantom image location in a stereo system is very sensitive to changes in interchannel delay. For example, according to Simonsen, an interchannel delay difference of only 200 µs (that’s 0.0002 seconds!) will result in a 30% change in phantom image location. In other words, if you have a “correct” stereo configuration where your loudspeakers are placed +/- 30º from centre front, then delaying one loudspeaker by 200 µs will move the centre phantom image to 9º off-centre (or 30% of the way to the earlier loudspeaker).
Let’s simplify, just to get an idea of what we’re talking about in our experimental results:
Case 1: If the microphone is 3 m from the tweeter and the air temperature is 25º C for all 3 m of travel, then the speed of sound for the entire trip is 346.3000 m/s and the total travel time is therefore 8.6630 ms.
Case 2: If the microphone is 3 m from the tweeter and the air temperature for the first 50 cm of travel is 44º C and the remaining 2.5 m of travel is 25º C, then the speed of sound for the first 50 cm is 357.7 m/s and for the remaining 2.5 m it’s 346.3 m/s. This means you have a total travel time of 8.6170 ms.
The difference between Case 1 and Case 2 is 8.6630 – 8.6170 = 0.046 ms or 46 µs, which, according to Simonsen’s results would correspond to something like a 5% shift in centre image location. Audible? Perhaps, but just barely… However, if you’re checking my math, you’ll note that a 46 µs change in time is equivalent to a 264º change in phase at 16 kHz, which was much larger than the roughly 85º we measured in the analysis above (see Figure 13)… So, my simplified example here seems to be exaggerating the effect, which means that a guess (even a calculated guess) of a 46 µs interchannel latency difference is probably an overestimate…
So, we might be able to conclude that the effect of this with respect to change in time of arrival are also inaudible, according to the data…
You may notice that I’ve avoided an obvious question throughout the above: “Why does the magnitude of the signal change?” If you look at this site, for example, you’ll see that although there is a change in sound absorption with change in air temperature, it is a very small effect. So, why do we measure such a large change in magnitude (or level) correlated with the temperature of the hot plate? There are two possible explanations for this.
The first was already discussed. At low temperature settings, the variation in level is probably simply an artefact of the background noise. All of these measurements were done in the Cube at B&O – which is normally used for a different kind of measurement which is more immune to background noises. This means that the Cube itself doesn’t have to be quiet, so it isn’t soundproofed from the outside world. Extraneous noises such as wind, rain, or someone walking by pushing a cart in the hallway, are easily audible if you’re sitting in the Cube. However, for the measurements in this experiment, those background noises will infect the results.
The second explanation is not related to background noise. As you can see in Figure 12, at higher frequencies, there is a definite increase in level variations caused by increasing temperature of the hot plate. However, the effect is too big to be attributed to absorption changes related to temperature changes. So, what is it? Our best guess is that it’s the result of the changes in thermal currents (in other words, the hot air rising) in front of the tweeter resulting in thermal gradients (differences of temperature in space). This causes differences in speed of sound in space causing refraction of the wavefront. The higher the frequency, the more the tweeter is “beaming” so the effect is more evident than it is at low frequencies where the loudspeaker is more omnidirectional. (Spinning a flashlight generates a more obvious than spinning a naked light bulb.) As the temperature changes in time, the sound beam from the tweeter moves towards and away from the microphone input, which looks like a change in level.

If we had used a cluster of microphones instead, we would very probably have seen the “beam” moving to another microphone as it went quiet at the main mic… Maybe we’ll do that experiment someday and call it “research” – but for now we have the answer we were looking for, so we’ll leave that one for another day…
So, after all that, our end conclusion was, for an active high-end loudspeaker, we should not put radiators directly below the midranges and tweeters – it’s better to put them behind the loudspeaker like we do already in the BeoLab 5 or BeoLab 20, for example. Or perhaps above the tweeter could also be an option – although that might be a challenge for the visual designers…
There’s no guarantee that the artefacts will be audible (in fact, they almost certainly won’t if you’re not paying attention to the phantom image location, or if you aren’t sitting in the sweet spot… but if those were the case, we probably wouldn’t be talking about a high-end loudspeaker…) but the artefacts are certainly measurable – and that’s enough for us to go looking for a better place to put the amplifier radiators.
And now, I guess this also means that when someone types “loudspeaker amplifier heat phantom image” into Google, they’ll get an answer…