
#51 in a series of articles about the technology behind Bang & Olufsen loudspeakers
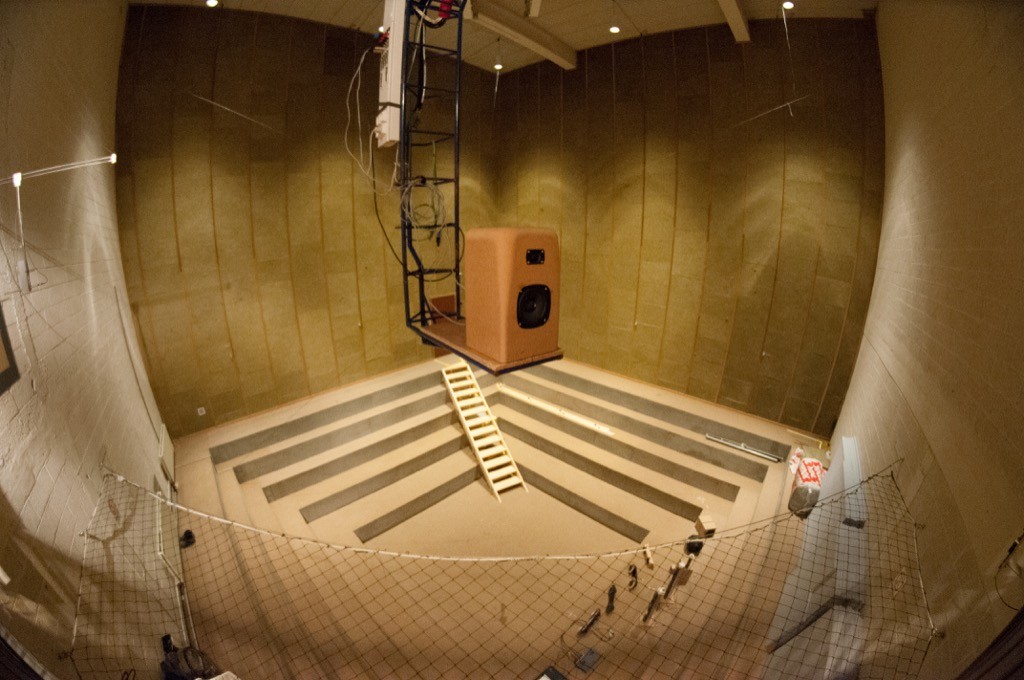
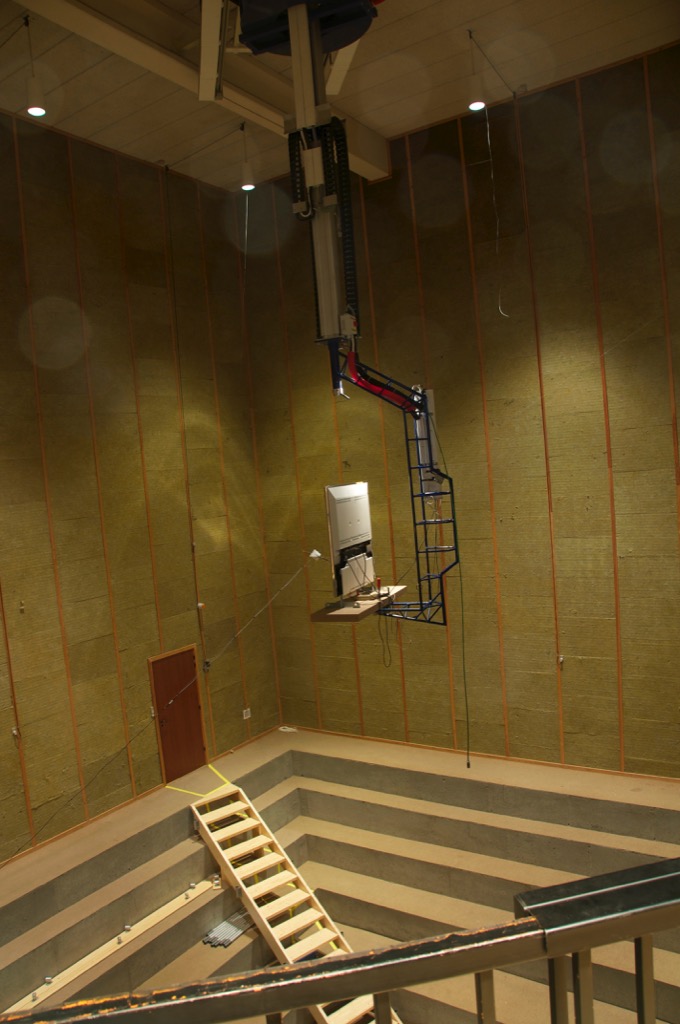
Sometimes, we have journalists visiting Bang & Olufsen in Struer to see our facilities. Of course, any visit to Struer means a visit to The Cube – our room where we do almost all of the measurements of the acoustical behaviour of our loudspeaker prototypes. Different people ask different questions about that room – but there are two that come up again and again:
Of course, the level of detail of the answer is different for different groups of people (technical journalists from audio magazines get a different level of answer than lifestyle journalists from interior design magazines). In this article, I’ll give an even more thorough answer than the one the geeks get. :-)
Our goal, when we measure a loudspeaker, is to find out something about its behaviour in the absence of a room. If we measured the loudspeaker in a “real” room, the measurement would be “infected” by the characteristics of the room itself. Since everyone’s room is different, we need to remove that part of the equation and try to measure how the loudspeaker would behave without any walls, ceiling or floor to disturb it.
So, this means (conceptually, at least) that we want to measure the loudspeaker when it’s floating in space.
Basically, the measurements that we perform on a loudspeaker can be boiled down into four types:
Luckily, if you’re just a wee bit clever (and we think that we are…), all four of these measurements can be done using the same basic underlying technique.
The very basic idea of doing any audio measurement is that you have some thing whose characteristics you’re trying to measure – the problem is that this thing is usually a link in a chain of things – but you’re only really interested in that one link. In our case, the things in the audio chain are electrical (like the DAC, microphone preamplifier, and ADC) and acoustical (like the measurement microphone and the room itself).
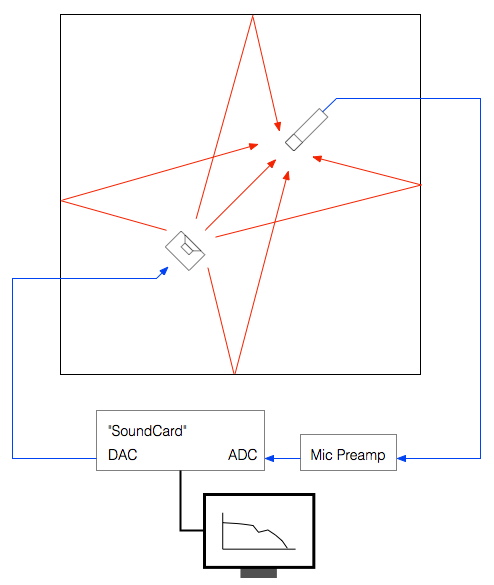
The computer sends a special signal (we’ll come back to that…) out of its “sound card” to the input of the loudspeaker. The sound comes out of the loudspeaker and comes into the microphone (however, so do all the reflections from the walls, ceiling and floor of the Cube). The output of the microphone gets amplified by a preamplifier and sent back into the computer. The computer then “looks at” the difference between the signal that it sent out and the signal that came back in. Since we already know the characteristics of the sound card, the microphone and the mic preamp, then the only thing remaining that caused the output and input signals to be different is the loudspeaker.
There are lots of different ways to measure an audio device. One particularly useful way is to analyse how it behaves when you send it a signal called an “impulse” – a click. The nice thing about a theoretically perfect click is that it contains all frequencies at the same amplitude and with a known phase relationship. If you send the impulse through a device that has an “imperfect” frequency response, then the click changes its shape. By doing some analysis using some 200-year old mathematical tricks (called “Fourier analysis“), we can convert the shape of the impulse into a plot of the magnitude and phase responses of the device.
So, we measure the way the device (in our case, a loudspeaker) responds to an impulse – in other words, its “impulse response”.
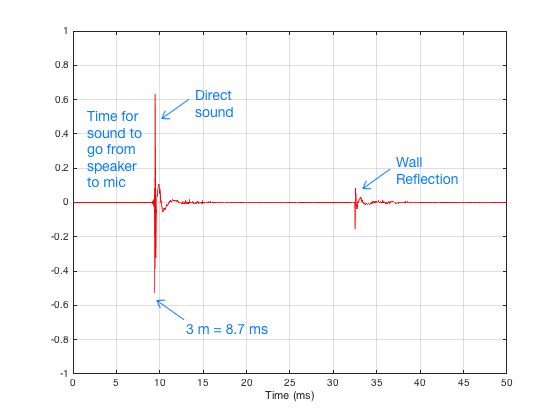
There are three things to initially notice in this figure.
In order to get a measurement of the loudspeaker in the absence of a room, we have to get rid of those reflections… In this case, all we have to do is to tell the computer to “stop listening” before that reflection arrives. The result is the impulse response of the loudspeaker in the absence of any reflections – which is exactly what we want.
Great. That’s a list of the basic measurements that come out of The Cube. However, I still have’t directly answered the original questions…
Let’s take the second question first: “Why isn’t The Cube an anechoic chamber?”
This raises the question: “What’s an anechoic chamber?” An anechoic chamber is a room whose walls are designed to be absorptive (typically to sound waves, although there are some chambers that are designed to absorb radio waves – these are for testing antennae instead of loudspeakers). If the walls are perfectly absorptive, then there are no reflections, and the loudspeaker behaves as if there are no walls.
So, this question has already been answered – albeit indirectly. We do an impulse response measurement of the loudspeaker, which is converted to magnitude and phase response measurements. As we saw in Figure 5, the reflections off the walls are easily visible in the impulse response. Since, after the impulse response measurement is done, we can “delete” the reflection (using a process called “windowing”) we end up with an impulse response that has no reflections. This is why we typically say that The Cube is “pseudo-anechoic” – the room is not anechoic, but we can modify the measurements after they’re done to be the same as if it were.
Now to the harder question to answer: “Why is the room so big?”
Let’s say that you have a device (for example, a loudspeaker), and it’s your job to measure its magnitude response. One typical way to do this is to measure its impulse response and to do a DFT (or FFT) on that to arrive at a magnitude response.
Let’s also say that you didn’t do your impulse response measurement in a REAL free field (a space where there are no reflections – the wave is free to keep going forever without hitting anything) – but, instead, that you did your measurement in a real space where there are some reflections. “No problem,” you say “I’ll just window out the reflections” (translation: “I’ll just cut the length of the impulse response so that I slice off the end before the first reflection shows up.”)
This is a common method of making a “pseudo-anechoic” measurement of a loudspeaker. You do the measurement in a space, and then slice off the end of the impulse response before you do an FFT to get a magnitude response.
Generally speaking, this procedure works fairly well… One thing that you have to worry about is a well-known relationship between the length of the impulse response (after you’ve sliced it) and the reliability of your measurement. The shorter the impulse response, the less you can trust the low-frequency result from your FFT. One reason for this is that, when you do an FFT, it uses a “slice” of time to convert the signal into a frequency response. In order to be able to measure a given frequency accurately, the FFT math needs at least one full cycle within the slice of time. Take a look at Figure 6, below.
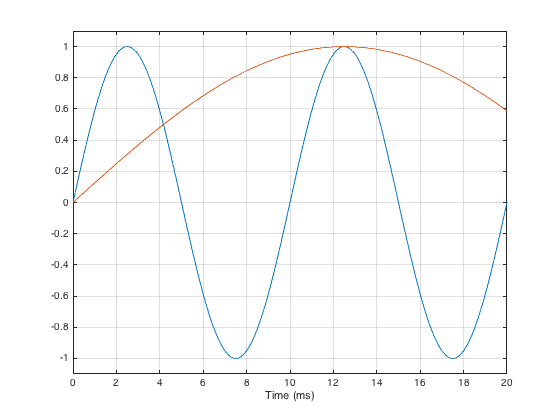
As you can see in that plot, if the slice of time that we’re looking at is 20 ms long, there is enough time to “see” two complete cycles of a 100 Hz sine tone (in blue). However, 20 ms is not long enough to see even one half of a cycle of a 20 Hz sine tone (in red).
However, there is something else to worry about – a less-well-known relationship between the level and extension of the low-frequency content of the device under test and the impulse response length. (Actually, these two issues are basically the same thing – we’re just playing with how low is “low”…)
Let’s start be inventing a loudspeaker that has a perfectly flat on-axis magnitude response but a low-frequency limitation with a roll-off at 10 Hz. I’ve simulated this very unrealistic loudspeaker by building a signal processing flow as shown in Figure 7.

If we were to do an impulse response measurement of that system, it would look like the plot in Figure 8, below.
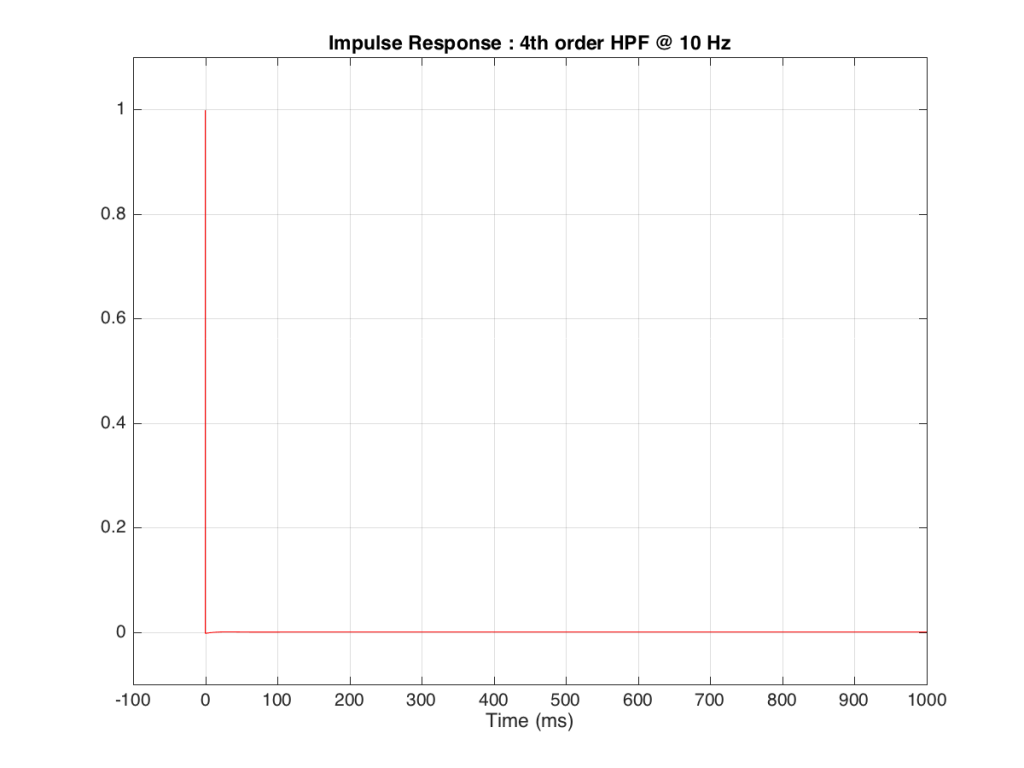
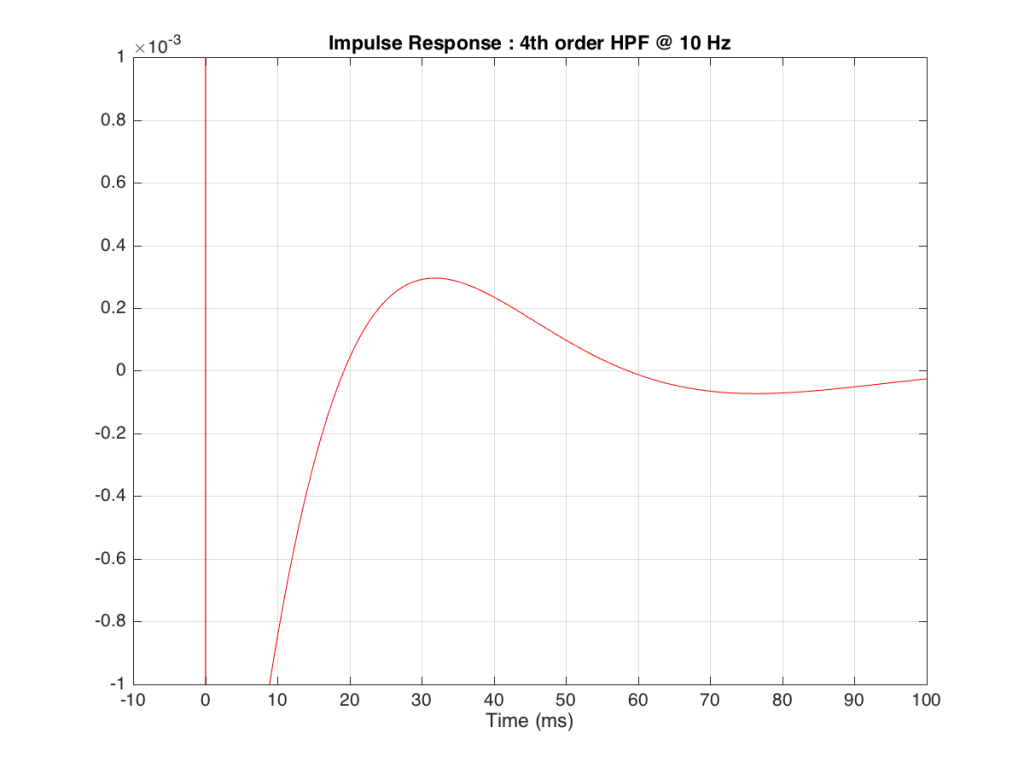
Figure 9, above shows a closeup of what happens just after the impulse. Notice that the signal drops below 0, then swings back up, then negative again. In fact, this keeps happening – the signal goes positive, negative, positive, negative – theoretically for an infinite amount of time – it never stops. (This is why the filters that I used to make this high pass are called “IIR” filters or “Infinite Impulse Response” filters.)
The problem is that this “ringing” in time (to infinity) is very small. However, it’s more easily visible if we plot it on a logarithmic scale, as shown below in Figure 10.
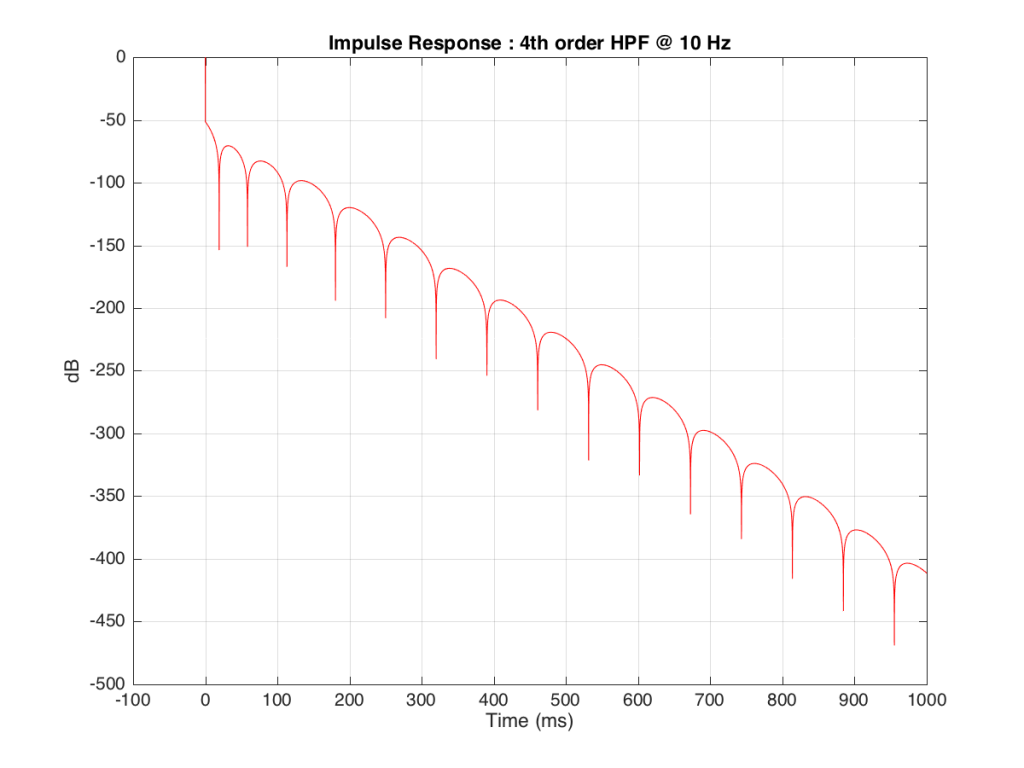
As you can see there, after 1 second (1000 ms) the oscillation caused by the filtering has dropped by about 400 dB relative to the initial impulse (that means it has a level of about 0.000 000 000 000 000 000 01 if the initial impulse has a value of 1). This is very small – but it exists. This means that, if we “cut off” the impulse to measure its frequency response, we’ll be cutting off some of the signal (the oscillation) and therefore getting some error in the conversion to frequency. The question then is: how much error is generated when we shorten the impulse length?
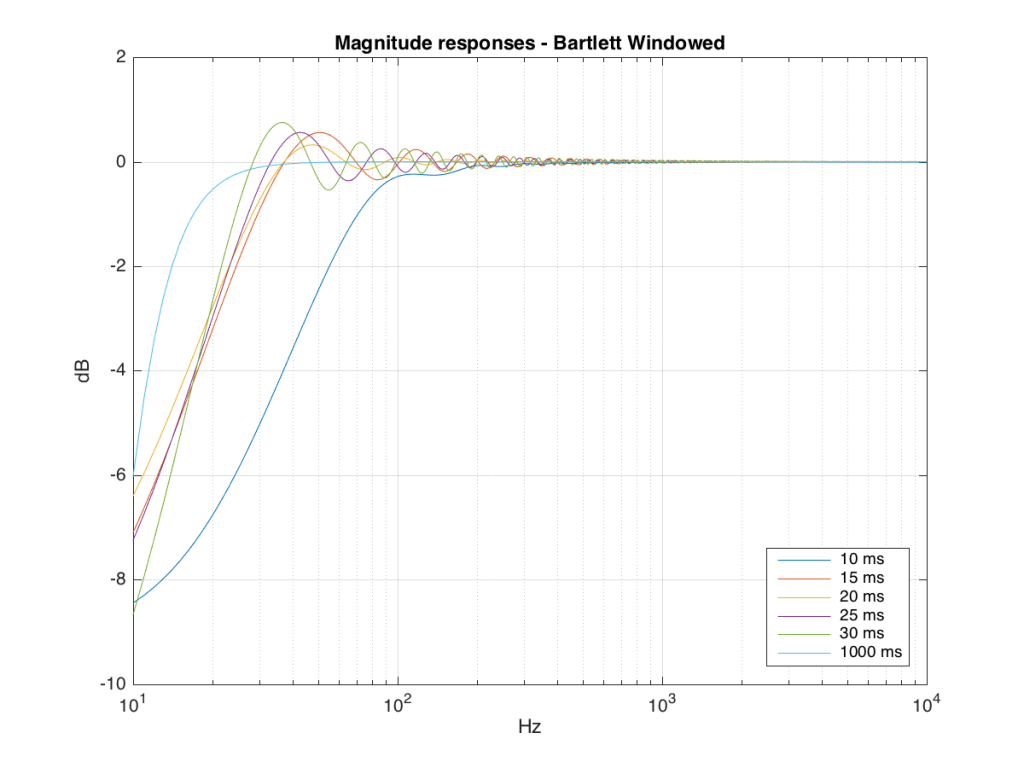
We won’t do an analysis of how to answer this question – I’ll just give some examples. Let’s take the total impulse response shown in Figure 6 and cut it to different lengths – 10, 15, 20, 25, 30 and 1000 ms. For each of those versions, I’ll take an FFT and look at the resulting magnitude response. These are shown below in Figure 11.
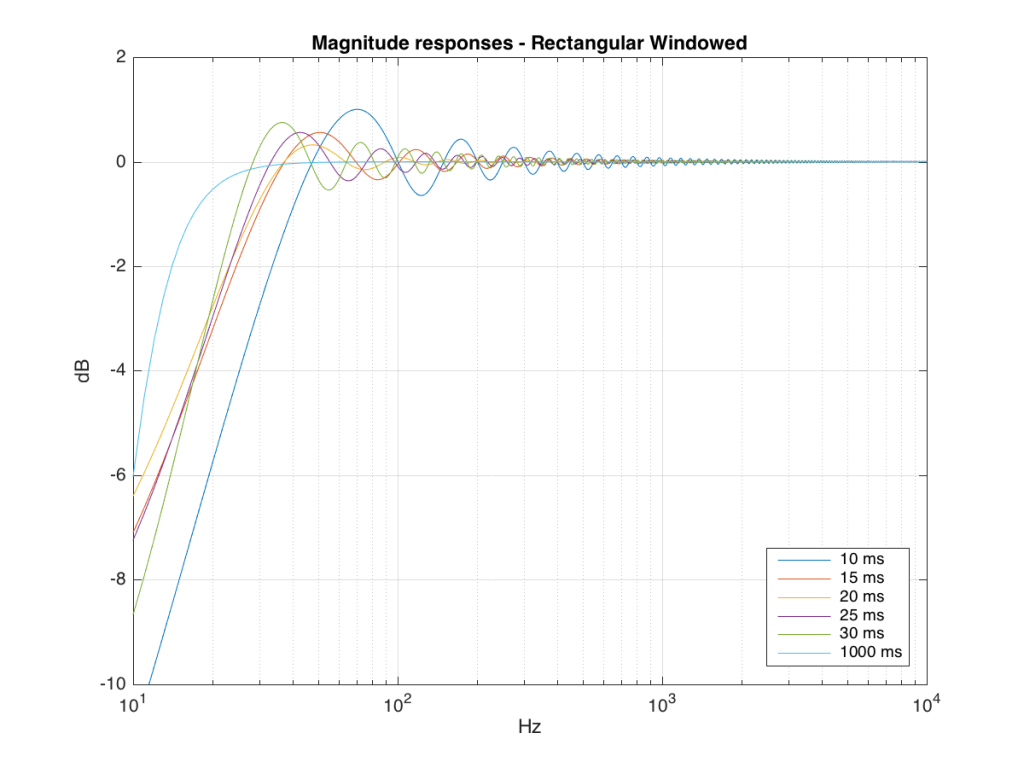
Figure 11: The magnitude responses resulting from taking an FFT of a shortened portion of a single impulse response plotted in Figure 8.
We’ll assume that the light blue curve in Figure 9 is the “reference” since, although it has some error due to the fact that the impulse response is “only” one second long, that error is very small. You can see in the dark blue curve that, by doing an FFT on only the first 10 ms of the total impulse response, we get a strange behaviour in the result. The first is that we’ve lost a lot in the low frequency region (notice that the dark blue curve is below the light blue curve at 10 Hz). We also see a strange bump at about 70 Hz – which is the beginning of a “ripple” in the magnitude response that goes all the way up into the high frequency region.
The amount of error that we get – and the specific details of how wrong it is – are dependent on the length of the portion of the impulse response that we use.
If we plot this as an error – how wrong is each of the curves relative to our reference, the result looks like Figure 12.
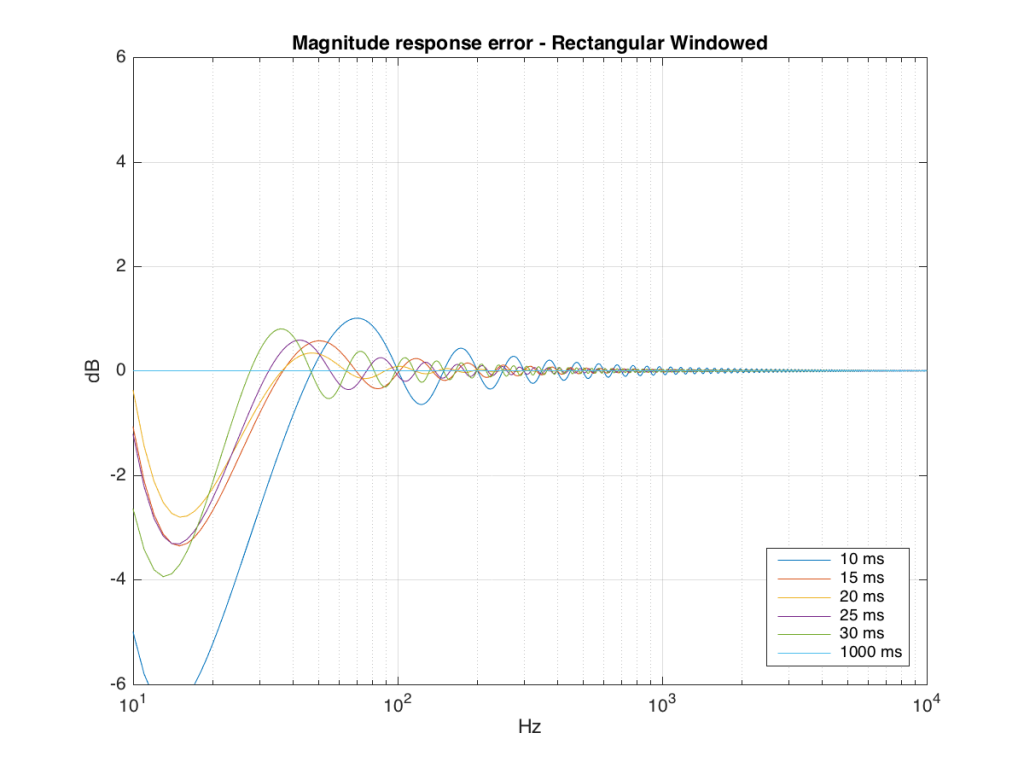
As you can see there, using a shorted impulse response produces an error in our measurement when the signal has a significant low frequency output. However, as we said above, we shorten the impulse response to delete the early reflections from the walls of The Cube in our measurement to make it “pseudo-anechoic”. This means, therefore, that we must have some error in our measurement. In fact, this is true – we do have some error in our measurement – but the error is smaller than it would have been if the room had been smaller. A bigger room means that we can have a longer impulse response which, in turn, means that we have a more accurate magnitude response measurement.
“So why not use an anechoic chamber and not mess around with this ‘pseudo-anechoic’ stuff?” I hear you cry… This is a good idea, in theory – however, in practice, the problem that we see above is caused by the fact that the loudspeaker has a low-frequency output. Making a room anechoic at a very low frequency (say, 10 Hz) would be very expensive AND it would have to be VERY big (because the absorptive wedges on the walls would have to be VERY deep – a good rule of thumb is that the wedges should be 1/4 of the wavelength of the lowest frequency you’re trying to absorb, and a 10 Hz wave has a wavelength of 34.4 m, so you’d need wedges about 8.6 m deep on all surfaces… This would therefore be a very big room…)
Of course, there are some tricks that can be played to make the room seem bigger than it is. One trick that we use is to do our low-frequency measurements in the “near field” which is much closer than 3 m from the loudspeaker, as is shown in Figure 13 below. The advantage of doing this is that it makes the direct sound MUCH louder than the wall reflections (in addition to making the difference in their time of arrival at the microphone slightly longer) which reduces their impact on the measurement. The problem with doing near-field measurements is that you are very sensitive to distance – and you typically have to assume that the loudspeaker is radiating omnidirectional – but this is a fairly safe assumption in most cases.

Those of you with some experience with FFT’s may have heard of something called a windowing function which is just a fact way to slice up the impulse response. Instead of either letting signal through or not, we can choose to “fade out” the impulse response more gradually. This changes the error that we’ll get, but we’ll still get an error, as can be seen below.
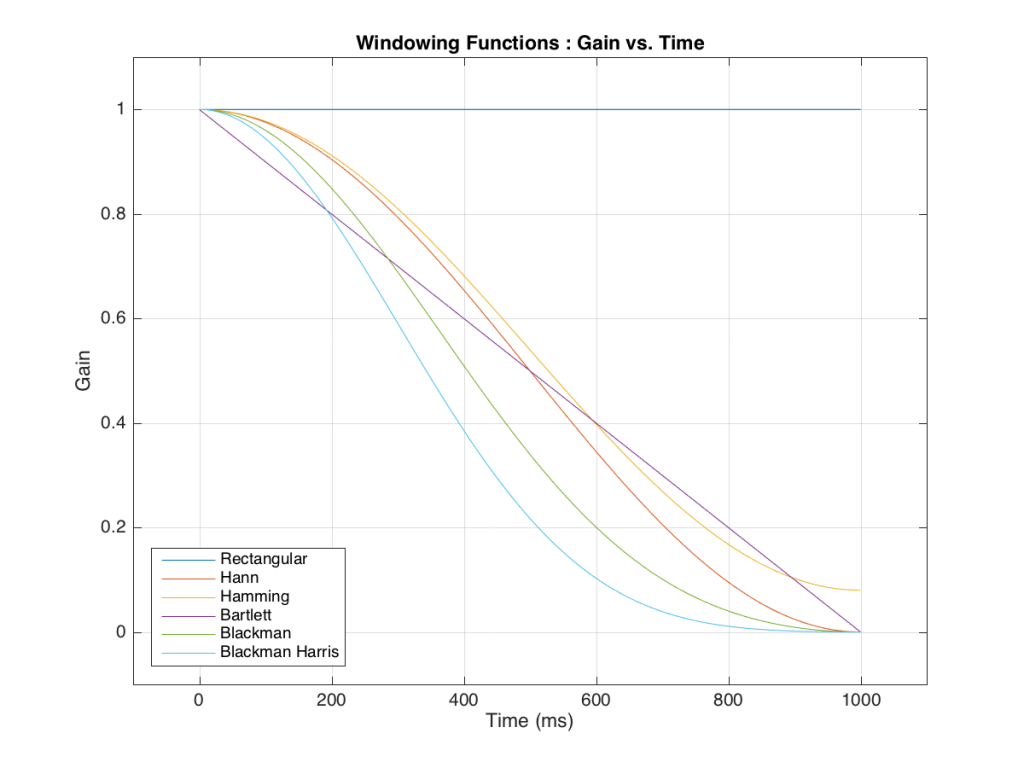
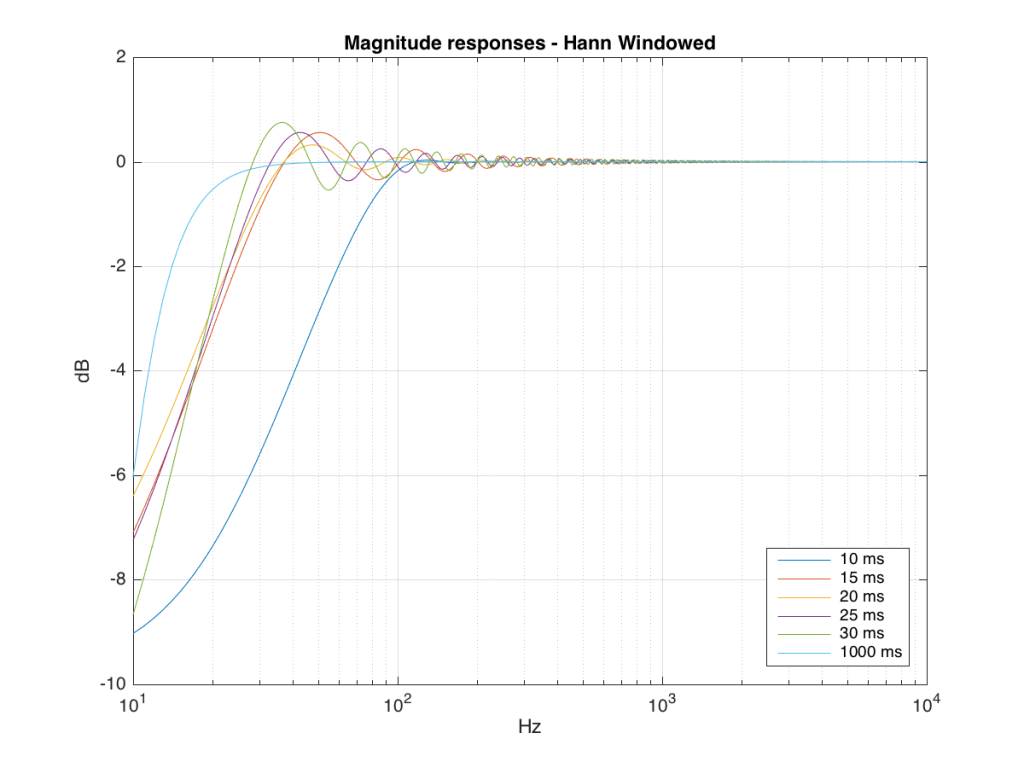
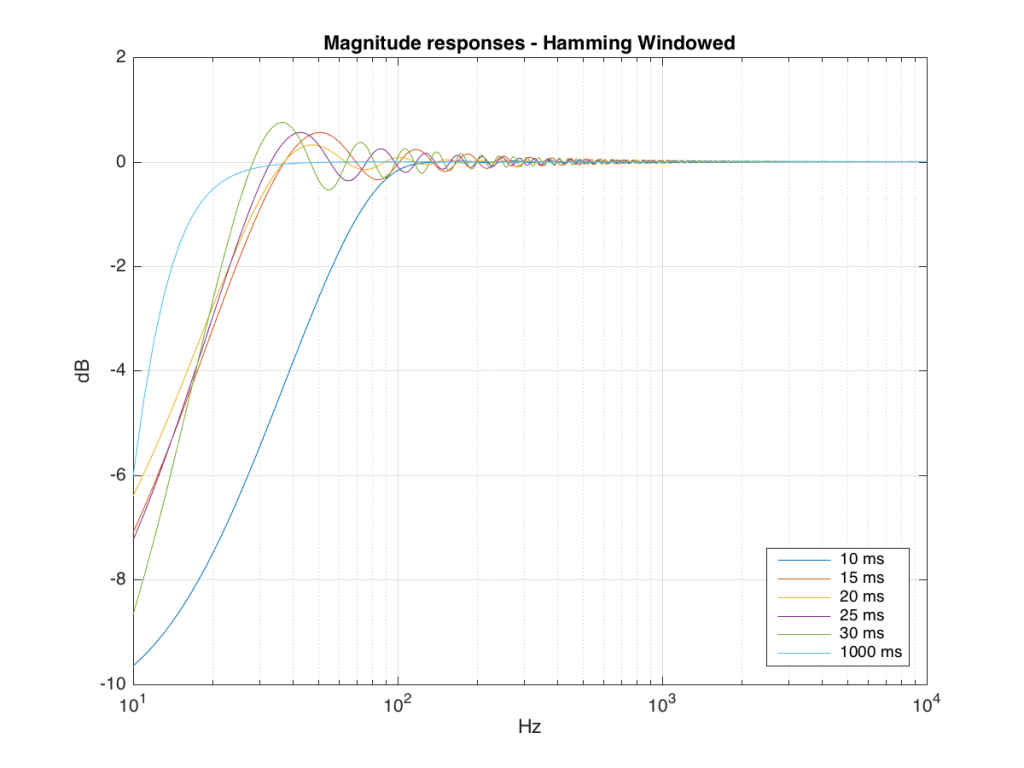
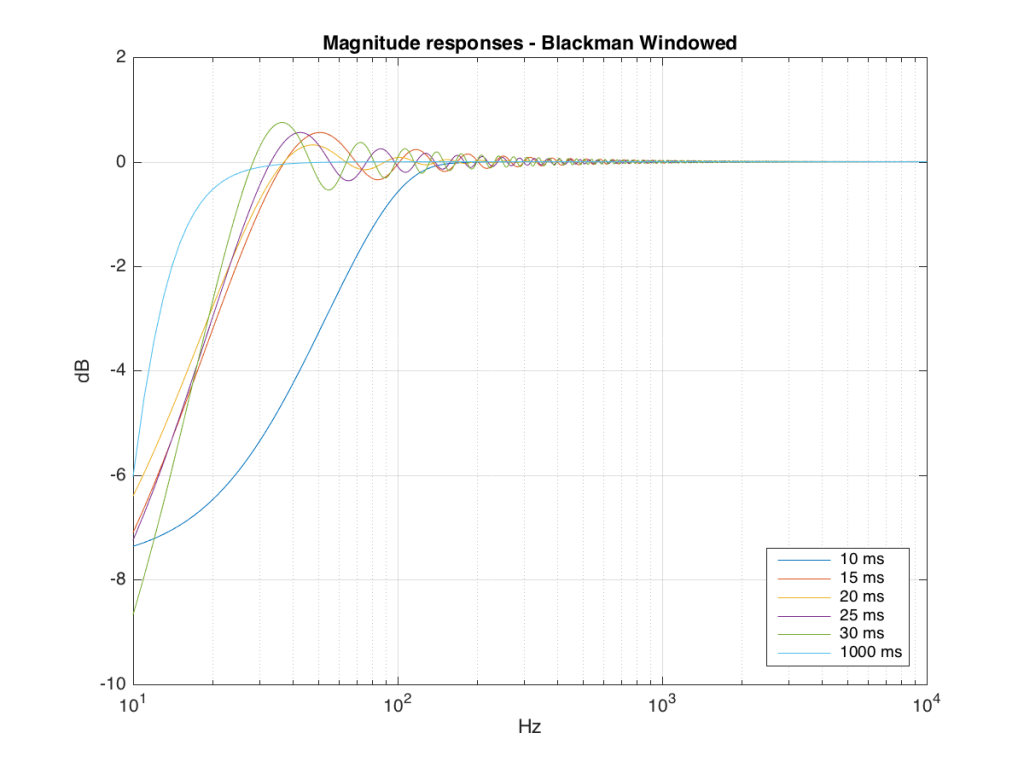
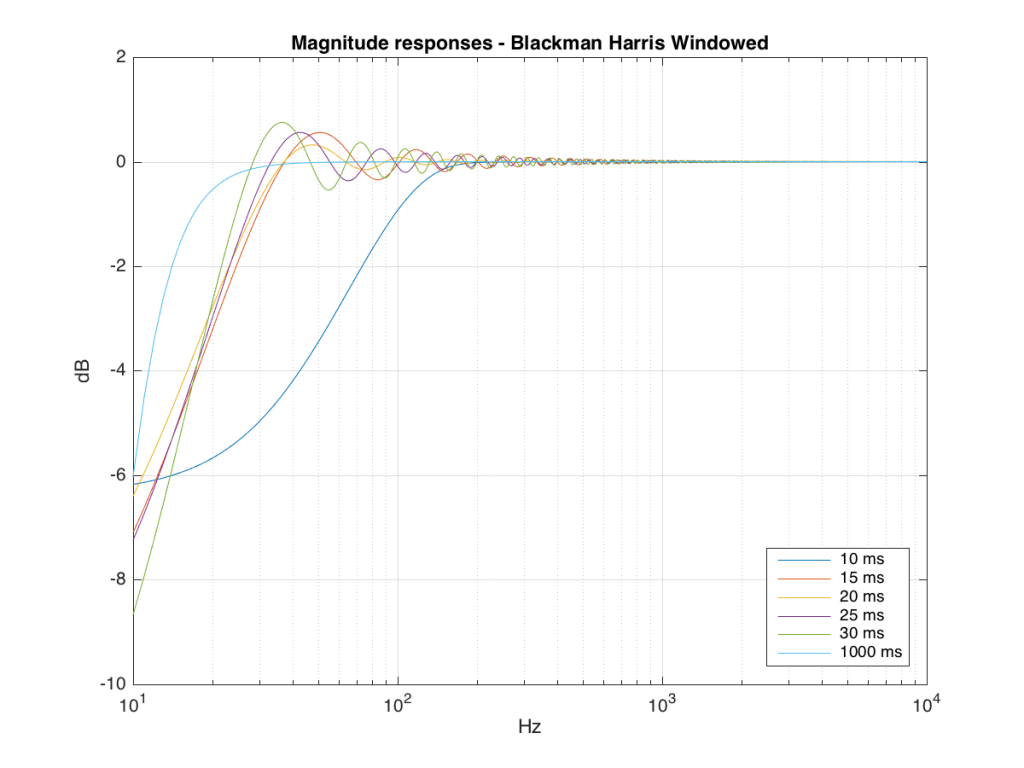
So, as you can see with all of those, the error is different for each windowing function and impulse response length – but there’s no “magic bullet” here that makes the problems go away. If you have a loudspeaker with low-frequency output, then you need a longer impulse response to see what it’s doing, even in the higher frequencies.
#50 in a series of articles about the technology behind Bang & Olufsen loudspeakers
Before we begin, if you’re unfamiliar with the concept of a “room mode”, it might be useful to review three other postings:
But what if my room is Scandinavian?
and
Active Room Compensation – Some Details, Part 1
At the end of that last posting, I said:
“P.S. As I mentioned briefly in this posting, Active Room Compensation has one additional feature – multichannel processing. That will be explained later in Part 2.”
So, that’s the theme for this article – the multichannel aspect of Active Room Compensation.
Let’s start by looking at Figure 1, below.
This is a basic representation of the fundamental room mode in one dimension of a room. If a loudspeaker is placed at the location of the red circle and it produces energy at the same frequency of the room mode, then the room will resonate, just like a closed pipe, as can be seen in the animation.
One important thing to notice in the figure above is that when the pressure on one side of the room goes positive, the opposite side goes negative. In other words, the two sides of the room are in opposite polarity. This information will come in handy later.
Now let’s look at the second harmonic – this is a resonance that has a frequency that is two times that of the fundamental mode. Its behaviour in one dimension of the room is shown below. Again, the loudspeaker is in the position of the red circle.
Now, you’ll notice, the two sides of the room have the same polarity – when one goes positive, so does the other. It’s the centre of the room that is in opposite polarity to the sides.
If you measure the natural response of a loudspeaker that is otherwise flat (let’s not split hairs over whether we’re talking about on-axis magnitude response or the power response – for the purposes of this discussion, it’s irrelevant) in a one-dimensional room like the one shown above, you’ll see that there is a natural peak in the response at each frequency where you have a room mode. The result will look something like Figure 3, below
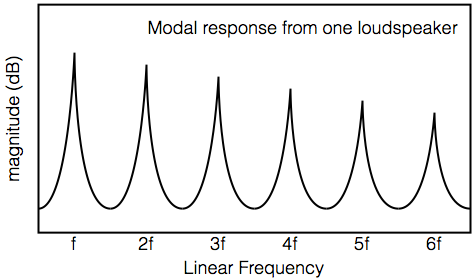
As you can see there, every mode is excited by the loudspeaker (we’re assuming that the loudspeaker is not sitting on a “node” and therefore not coupling to the room mode at all).
So, if you build a room compensation system that only takes one loudspeaker into account, then it will measure a response similar to the one in Figure 3, and it will create a compensation filter that looks something like the one shown in Figure 4.
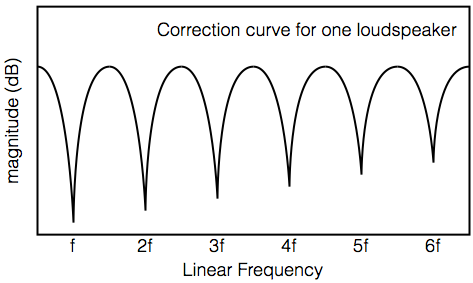
Assuming that you’re careful about your measurements, and you consider things like phase response in your creation of the filter, this system will work very well with just one small problem: most people don’t use only one loudspeaker – they use at least two.
So, how does this change things?
Let’s go back and consider our room modes again, this time with two loudspeakers.
Figure 5, above, shows the same room as in Figure 1, but now I’ve plotted the locations of two loudspeakers, one on the left (atypically, in red) and one on the right (in black). Notice that these two points in the room, when the room mode is ringing, are opposite in polarity (or “out of phase” as many people say…). However, consider that, in most recordings, the bass (which is, in most cases, a good estimation of the frequency band of the fundamental room mode) is panned to the centre, and therefore is “in phase” in the two channels.
In other words, in almost all cases, the two loudspeakers are producing the same signal at the same level, in phase (and therefore with the same polarity). However, the room is ringing in opposite polarity at the two loudspeakers.
What’s the result of this conflict? It’s simple – the room mode is naturally cancelled by the signals in the loudspeakers. In other words, there is no need to apply room correction for a recording like this, with the loudspeakers in the locations that they’re shown in, for this room mode.
So, if you measure each loudspeaker individually, you’ll put a dip in their responses that should not be there to compensate for a room mode that is not ringing. You must consider both loudspeakers playing a correlated signal, and how that will interact with the room mode.
Now let’s look at the next harmonic, shown below in Figure 6.

Now you can see that the mode is ringing in the same phase at the two loudspeaker positions. So, if the bass (still a good guess…) is in phase in the two channels (also a good guess…) then this resonance will be twice as bad as it would be with only one loudspeaker. Again, we need to consider the behaviour of the room mode with a correlated signal in the two loudspeakers – but this time things are worse instead of non-existent.
So, this means that we have to re-consider our room compensation filter. Instead of measuring each loudspeaker independently and building a filter for each one and ignoring that people rarely listen in mono, we have to measure the two (or more) loudspeakers and analyse the way that different signals will interact with the room modes.
For example, in the simple case shown above, we might wind up with the two filters shown in Figure 7 and 8.
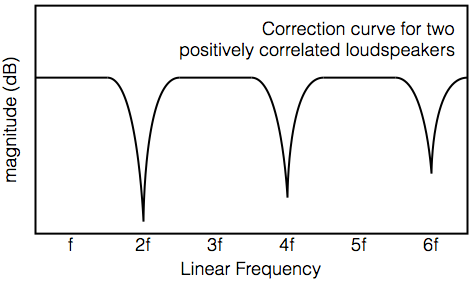
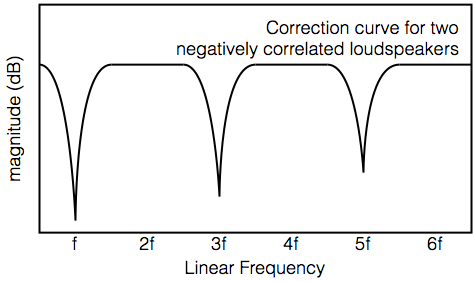
Now, you might be saying “I understand Figure 7 – lots of signals have the same polarity in the two loudspeakers (like the vocals, the bass, the kick drum – anything panned to the centre). But what signals are out-of-phase if I’ve connected by loudspeakers correctly?”
The answer to this comes mainly from classical recordings where it is normal to use microphones (usually omnidirectional) that are spaced apart. In this case, signals enter the two microphones are different times (depending on the angle to the sound source) – and a time difference results in a phase difference.
This processing is done in Beolab 90‘s Active Room Compensation to ensure that the loudspeakers are best optimised, not only to the room they’re in, but their locations within it, and its interaction with the recordings you’re playing. The end result is that each loudspeaker “knows” that the other one is in the room – each not only considers the other’s effect on the room’s response, but they “help each other” to control the room modes.
Of course, I’ve left out a lot of details in this description – for example, the actual responses of the correlated and negatively correlated signals will not really look like the ones I’ve shown here; most rooms contain more than one dimension; and I haven’t talked about boundary effects. In addition, everything I’ve said here is just an example using a very simplified view of the universe. The measurements of the loudspeakers at the microphone positions will result in very different responses than the ones shown here, which will, in turn, result in very different compensation filters.
*Most people don’t seem to know it, but “stereophonic sound” (or “stereo” if you’re into the whole brevity thing) means that you have two or more audio channels. Just thought I’d be explicit here – in case anyone was wondering.
“B&O has also succeeded in using all that technology to serve the music: the BeoLab 90’s sound quality equaled the general performance of any other speaker I’ve heard, and exceeded them in the resolution and stability of the sound-stages the pair of them presented.” (Kal Rubinson)
“For now, I exhort every caring music listener to listen to the BeoLab 90 and hear what is now possible. It’s that good. (KR)
“To say how impressed with how the BeoLab 90 measured in its Narrow mode would be an understatement. This loudspeaker demonstrates just how much can be achieved with intelligent use of DSP to optimise its acoustic performance. As Kal Rubinson summed up, it is a tour de force. Wow! (John Atkinson)
“Lyden av BeoLab 90 er vanskelig å forklare, den må egentlig bare oppleves. Personlig har jeg aldri hørt en mer livaktig musikkgjengivelse, og flere som har vært på besøk reagerte med å klype seg i armen eller felle en tåre når de hørte et opptak de kjente, eller rettere sagt trodde de kjente!”
“The sound of the BeoLab 90 is hard to explain, it must really be experienced. Personally I have never heard a more lifelike music reproduction, and several who have been visiting reacted by pinching their own arm or shedding a tear when they heard a recording they knew, or rather thought they knew!”
From fineartofliving.de: “Fazit: Bang & Olufsen BeoLab 90 – Die Zukunft des Klangs? Die Antwort darauf: Nach unserer Meinung zurzeit eine, wenn nicht sogar die beste Möglichkeit für optimales Klangerlebnis im High End-Bereich. Mit einer Einschränkung: Selbst angesichts des nicht minder beachtlichen Preises kann es aufgrund der hohen Nachfrage zu Lieferengpässen kommen…..
From www.hificlube.net: High End 2016 – Munich – Best Sound: Runner-up – “My colleague Martin Colloms wrote a long feature article about the Beolab 90 for Hificritic. Still I wasn’t ready for what I heard. An immersive holographic sound even when I was sitting no more than 5 feet away from the loudspeakers. Excellent focus, amazing localization of musicians and singers in the huge and deep soundstage. Maybe a hint of upper mid emphasis. To say that I am amazed is an understatement. It gets an A verging on the A+…”

soundstagehifi.com: “…this demonstration was, by far, the best I heard – and the BeoLab 90 was my favorite product – at CES 2016.”
stereophile.com: “The sound was incredibly dynamic but relaxed. This was the best bass I heard at the show, and the most startlingly different soundstaging and midrange I experienced during CES 2016.
“The question I’ve been asked at every CES more often than any other is “Which sound system impressed you the most?” It’s a question that’s often difficult to answer. Typically, I’ve been impressed by several systems, often for different reasons, and it’s hard to say which was “the best.” That is, except at CES 2016. This time, I had no trouble answering this question: the BeoLab 90. The sound was utterly natural, effortless, with outstanding soundstage and imaging. I also couldn’t help but be impressed by the technology represented by this speaker system: 18 drivers of the highest quality, 18 amplifiers, full DSP control, cast aluminum enclosure. Given the components and the extensive research that went into the design of the speaker, $75,000 for the pair does not seem excessive.”

digitaltrends.com: “When we sat down for a short audition, we were gobsmacked by what we were hearing. Though we were in the very back of the room with enough people blocking our sight of the speakers that we could barely see the system, we heard a perfectly balanced presentation with the vocals seemingly coming from directly in front of us, just 2 feet away (someone’s head was in that spot).
audio-head.com: “From common audiophile test tracks to a sweet spot rotation, whoever was leading the charge at the company certainly seemed vastly familiar with the hobby’s eccentric standards. The sound of the BEOLAB 90 followed in suit, the quick listening session yielded surprisingly tight image and responsive dynamic range. The bass was big, properly proportioned and beautiful in a way that reminded me of other high end rigs that play in this price range. Overall, it felt like a very impressive presentation that didn’t disappoint, checking off boxes left and right for both the audiophile and the luxury lifestyle listener.”
AVSforum.com: “These speakers have real guts, and yet possess more finesse than passive speakers I’ve heard that cost even more. In the rarefied price point that they occupy, Bang and Olufsen’s flagship speakers actually strike me as a bargain, as outrageous as that may sound when discussing $80,000 speakers. But, that’s exactly how good they are. Respect.”
soundstageglobal.com: “what I heard from the pair at CES 2016 absolutely blew me away — the way the pair imaged, coupled with the fullness, richness, and presence exhibited, had me talking about them for the rest of the day. Now I feel a little foolish for at first thinking they were a stupid design. Don’t make the same mistake — hear a pair of 90s if you can.”

bloomberg.com: “We got a brief demo and the sound is incredible.”

wired.com: “The soundstage is breathtaking, the low end is positively massive. Possibly the best speakers I’ve ever heard. Possibly the very speakers Crom has in his throne room in Valhalla.”
highdefdigest.com: “Having two of these exquisite pieces focused on me made for a smooth, powerful sound that will likely standout in my memory for the rest of my life. For those who can indulge, I strongly advise doing so.”
“So how did the BeoLab 90 make us feel? When we closed our eyes in Bang & Olufsen’s special listening room, the pair of master reference speakers (#2 and #3 ever made)—along with the room—seemed to vanish the instant a song played. We weren’t listening to sound emanating from two specific points; instead, the Weeknd was singing his heart out right in front of us. Benny Goodman’s band performed an intimate set, and you could picture where each musician was sitting. The BeoLab 90’s ability to create such a lifelike three-dimensional sound stage is unparalleled when you’re sitting in the sweet spot. It certainly brings up the question of whether a speaker can be “too” good for the music—some now-classic albums weren’t necessarily well-recorded and mastered (think of when the Rolling Stones turned the basement of a rented French mansion into a makeshift studio slash drug den). But when all the variables align perfectly, the music engulfs listeners entirely and hits the guts. The result of such incredible technology and engineering happens to be a very visceral human experience.”
“Die Abbildung war phänomenal, jedes Instrument der gewählten Musik nahm ganz selbstverständlich den für sich bestimmten Platz im Raum ein, jedes Element war von Anfang bis Ende verfolg- und erlebbar. Aber nicht nur die Ortung verblüffte, auch die Detailgenauigkeit, mit der selbst kleinste Feinheiten bis zum erkälteten Backgroundsänger aufgedeckt wurde, sucht ihresgleichen.”
– modernhifi.de
“Vi kan bevidne, at effekten er besnærende. Højttalerne spiller sammen med lytterummet på en måde, vi ikke har oplevet før. Personligt har jeg aldrig hørt et mere holografisk realistisk lydbillede, hverken i eller uden for sweet spot. BeoLab 90 er også en fuldblods, fullrange-højttaler, der ikke overlader noget til tilfældighederne.”
– lydogbillede.dk
“I found that the size of the soundstage was consistently proportional to the size of the ensemble and the recording. I found that the bass was very well extended, taut, and satisfying. Most of all, I was impressed by the prototypes’ reproduction of detail throughout the audio band, and the uniformity of that quality across the soundstage.”
– Kalman Rubinson, Stereophile magazine (print version, October, 2015)
“Wohl noch nie haben Lautsprecher die musikali schen Akteure so scharf ins Wohnzimmer projiziert. Ganz gleich, ob grosse Orchester oder kleine Jazz-Formationen – jedes ein zelne Instrument hat seinen exakten Platz im virtuellen Raum, der auch seine Tiefen dimension verblüffend genau zu erkennen gibt: Der Hörer kann zum Beispiel fast in Zentimetern abzählen, wie weit das Schlag zeug hinter dem Kontrabass placiert ist. Dass der Beolab 90 auch für schwärzeste BassTiefe, überbordende Dynamik und feinen, luftigen Obertonglanz steht, müssen TestHörer der Vollständigkeit halber natür lich ebenfalls zu Protokoll geben, aber das eigentlich Spektakuläre des Lautsprechers ist tatsächlich seine überragende räumliche Abbildung.”
– NZZ am Sonntag 18. Oktober 2015
How Bang & Olufsen’s BeoLab 90 Became a Reality: www.coolhunting.com
Skønheden eller udhyret? Bag om B&O BeoLab 90: www.recordere.dk
BeoLab 90: B&O laver banebrydende højttaler: www.lydogbillede.dk
Beolab 90 is Bang & Olufsen’s striking 90th anniversary speaker: www.whathifi.com
Der Traum vom Raum: Frankfurter Allgemeine
Bang & Olufsen BeoLab 90: Erster Hörtest: www.modernhifi.de
diyaudio.com: “The Beolab 90 is a BEAST; I’m surprised Bang & Olufsen wasn’t kicked out of CES. I never even got close to the SPL limits of my Summas, but if the Beolab 90 had a limit, I couldn’t tell what it was. B&O cranked it up for a couple of tracks, and you could FEEL the bass. … The sound is clean and dynamic. The soundstage is whatever you give it; give it a good recording and the soundstage is pinpoint and huge, give it a crummy recording and it’s crummy. … If you couldn’t tell yet, this is the best speaker I’ve ever heard, bar none. In fact, I feel a little silly lumping it in with other loudspeakers.”
beoworld.org: I have heard a lot of powerful speakers, veeeery expensive speakers, crazy speakers and well, very much different setups. But the Beolab90 blew my mind! … The power in them, the presence of all the tones, the clarity of the sound, the smoothness, the details…. I could go on for ever. It was like I had smooth whipped butter made out of diamonds inside my ears. I will probably never again, or at least for sure not in a long time hear a speaker like this again. I will surely hear the BL90 again, but I doubt something else will beat this. It could very well be the best speaker ever made. Simple as that. Mind you, that they had only the basic software in them, so they are just getting better.”
This shows the relationship between the voltage applied to the terminals of a loudspeaker drivers (shown on the oscilloscope) and the excursion of the driver.
The frequency of the sine wave driving the system ranges from 1 Hz to 6 Hz, so we stay below the resonance frequency of the driver.
The jump in level as the frequency is increased is caused by the low frequency roll-off of the DAC that I’m using to send the signal to the amplifier. Its manufacturer wasn’t expecting anyone to use it at 1 Hz…
In the last posting I made, I did the typical over-simplification and implied that the movement of a loudspeaker diaphragm is “pistonic” (meaning that the whole diaphragm moves as one solid, stiff structure).
In real life, this is not true. I’ll write more about this in a future posting, but for now, I made an animation to show a couple of examples of an exaggerated real life… There’ll be an explanation of this later.